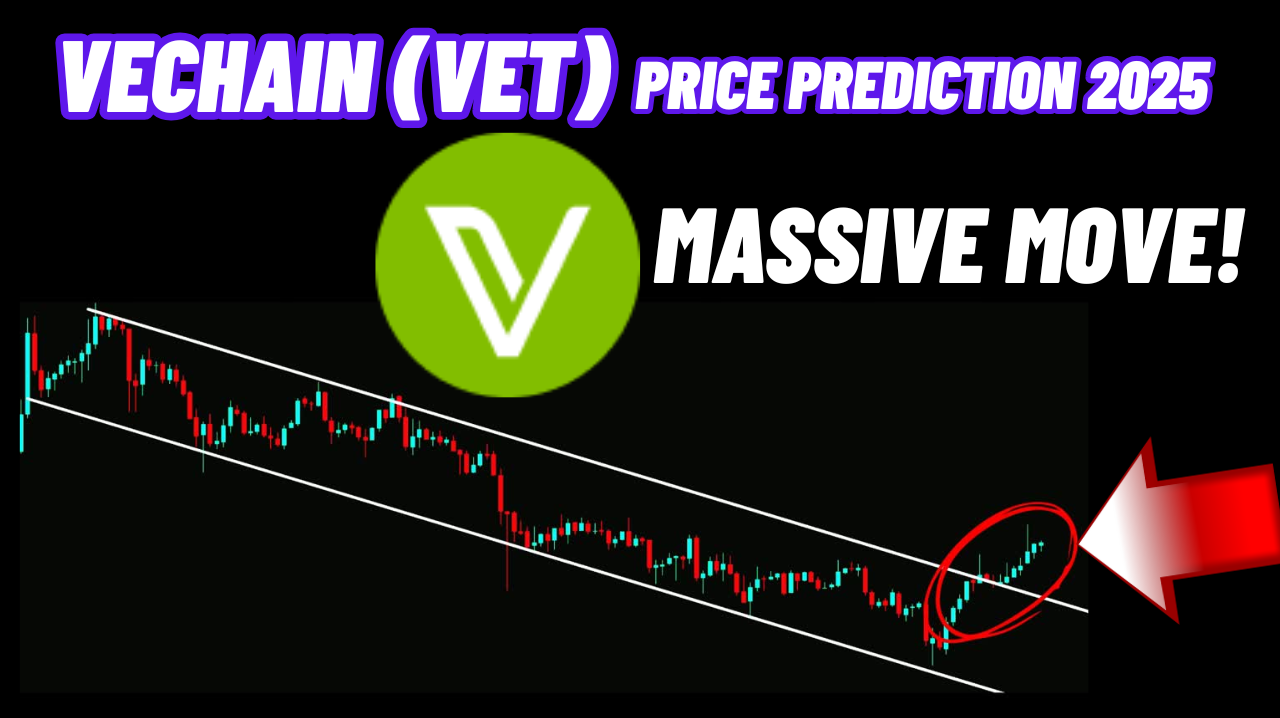
Hey friends, hope you are well. In this article, we're diving into a major update on VeChain (VET) and its recent price movements. There's a lot happening on the charts—from a breakout of a long-standing downtrend to the formation of a powerful bullish pattern. Let’s break it all down.
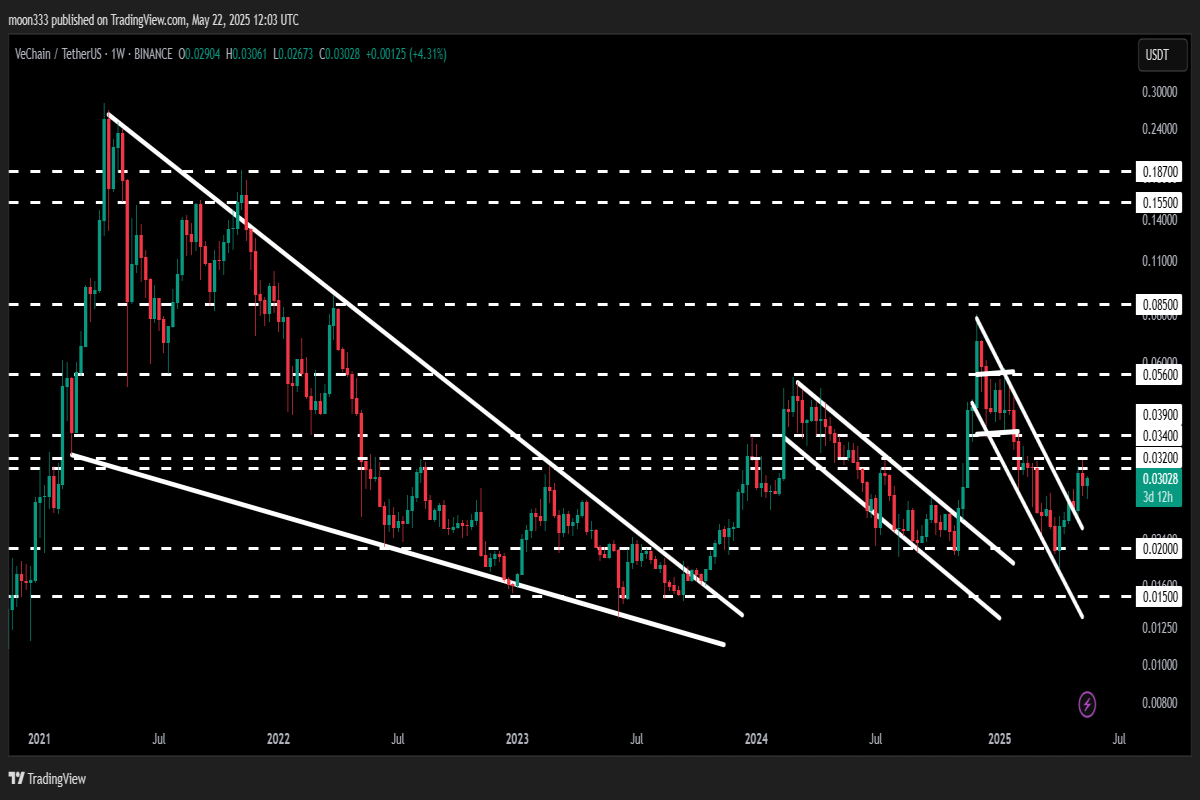
VeChain Breaks Out of a Long-Term Down Channel
Recently, VeChain’s price action has broken out of a significant descending channel. For months, the price had been trapped inside this structure, and along the way, it also fell below a horizontal channel—leading to a steep drop.
However, the breakout from this long-term down channel marks a strong shift in momentum. After the breakout, VET successfully retested the previous resistance as support, which is typically a bullish signal. From there, it geared up for another move.
Testing a Key Resistance Zone
Currently, VeChain is facing strong rejection at a long-term resistance zone between $0.032 and $0.034. This zone has historically acted as both support and resistance. For the past several weeks, it has been a clear hurdle for the bulls.
Breaking above this range could open the door for more significant price appreciation.
A Massive Falling Wedge Breakout
Another bullish development is visible on the 7-day time frame where VeChain has broken out of a massive falling wedge pattern—a classic bullish reversal setup. The breakout here signals a potential shift in the macro trend for VET.
Recent Trade Signal For VET Coin: Bullish Gartley Pattern
Three days ago, I shared a bullish Gartley pattern signal for VeChain paired with Bitcoin. This setup was identified on the daily time frame, showing a clear buying zone, sell target zone, and stop loss.
The price is still hovering inside the potential reversal zone, and there's a high probability it could soon reach the sell targets.
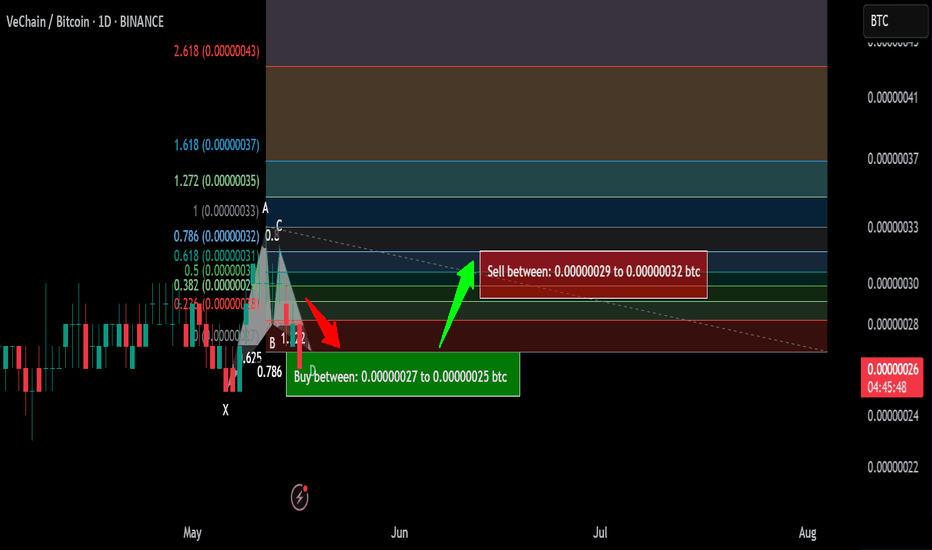
Click here to visit this trade signal:
Zooming into the Daily Time Frame
Since early December 2024, VeChain had been moving within a downward channel. We observed multiple rejections and support bounces within this structure:
-
Multiple bounce points and rejections
-
Final breakout of the downtrend resistance
-
Retest of resistance as support
-
Now attempting to break above $0.032–$0.034
If this level is cleared, the next resistance lies around $0.039 to $0.040, which previously acted as support in the horizontal channel.
Breakout Targets and Long-Term Outlook
Based on the breakout from the descending channel, the next major price target is the top of the previous structure at approximately $0.078.
Beyond that, a key resistance at $0.056 must also be overcome before we can aim for higher levels.
On the weekly chart, VeChain has already broken out of a long-term falling wedge, and the projected target for this pattern lies between $0.26 and $0.30 a massive upside potential.
Final Thoughts
This technical breakout and pattern formation is extremely bullish for VeChain. While short-term resistance levels may cause fluctuations, the overall trend looks positive—especially after confirming these breakouts.
Fore daily trade signals you can click the link below to join my Patreon or YourTube memberships: