
Introduction
In this article, we'll delve into the recent price movements and technical patterns observed in Kusama (KSM). The focus will be on the daily and 7-day time frame charts, where significant events such as fake breakouts, key resistance, and support levels have been identified. These patterns and levels could play a crucial role in KSM's future price action.
KSM Re-Enters Falling Wedge Pattern
On the daily time frame, KSM recently experienced a fake breakout from a falling wedge pattern. However, the price quickly re-entered the wedge and faced rejection at the long-term resistance level of $21.50. This level previously acted as support in November 2023 and also during November to December 2022. After forming a substantial double bottom at this support level, KSM experienced a strong rally. The recent rejection at $21.50 has led the price to retest the lower boundary of the falling wedge pattern.

Long-Term Resistance and Support Levels
The resistance at $21.50 is a significant hurdle that KSM needs to overcome to resume its upward momentum. This level has a history of serving as a robust support zone, and now as resistance, it is critical for future price action. If the price breaks above this resistance, it could signal the beginning of a substantial move.
Similarly, on the daily chart, KSM is approaching the support level of $16.50. This level has previously served as a support zone, and it could again provide a foundation for the price to bounce back.
Analysis of the 7-Day Time Frame Chart
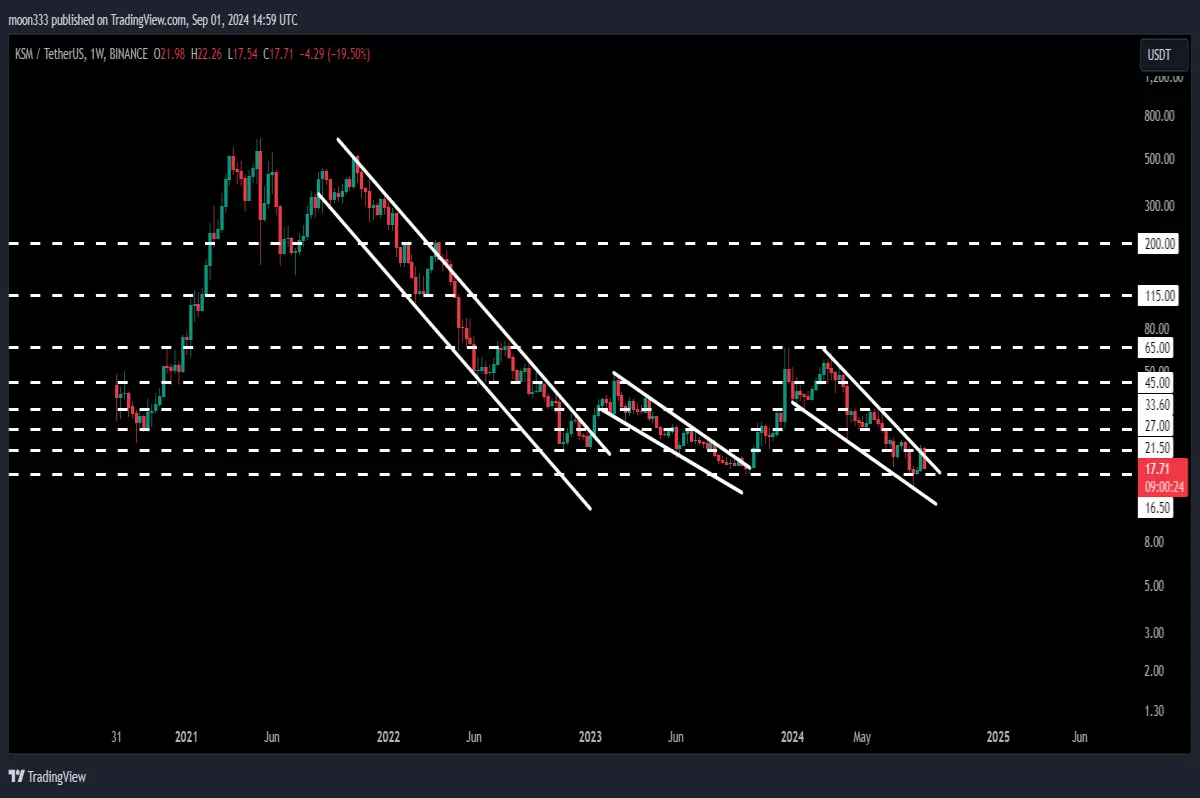
Switching to the 7-day time frame chart, KSM had earlier broken out of a long-term down channel, which led to a parabolic rally. However, the price got trapped inside another falling wedge pattern. To continue the rally that began in January 2023 after the breakout from the down channel, KSM needs to break out of this new falling wedge.
Potential Targets After Breakouts
The falling wedge pattern on the 7-day time frame is inherently bullish, suggesting a higher probability of a breakout. If KSM manages to break out of this wedge, the technical target could be around $65, which is the top of the wedge.
Furthermore, the technical target for the previous breakout from the down channel is much higher, at approximately $500. This target is based on the height of the channel and could be achieved if KSM continues its bullish trajectory.
Conclusion
Kusama (KSM) is currently at a critical juncture, with its price action closely tied to the breakout or breakdown of key resistance and support levels. Traders and investors should keep a close eye on the $21.50 resistance and $16.50 support levels, as well as the falling wedge pattern on both the daily and 7-day charts. A successful breakout from these patterns could signal significant upside potential for KSM.
For those interested in more detailed trading signals and analyses, consider joining as a YouTube or Patreon member, where I regularly share insights and updates.
Call to Action
If you found this analysis helpful, please hit the like button and follow the blog. For more trading signals and to support the work, you can join me as a YouTube member or Patreon member. Links are as below.






