
Hi guys and gals hope you are well, I posted a trading idea on 26th Feb 2020 where the priceline of Basic attention token (BAT) formed bullish Butterfly on 12 hour chart:

Click here to read previous article
On 2nd Mar the priceline started moving up and sofar it has produced more than 21% profit as below:
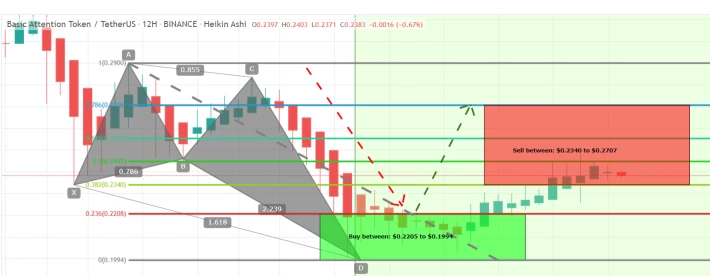
After Success Of Butterfly A New Pattern Is Formed:
Now this time on long term weekly chart the Basic attention token has formed a big bullish Cypher pattern and entered in potential reversal zone to move up.
Lest’s dig the pattern deeper to see how perfect this pattern is formed:
After initial leg (X to A) the A to B leg is retraced between 0.382 to 0.618 Fibonacci and then B to C leg is projected between 1.272 to 1.414 Fibonacci projection of A to B Fibonacci projection area and last leg (C to D) is retraced between 0.618 to 0.786 Fibonacci projection of X to C leg and now the price action is moving in potential reversal zone of this bullish BAT and now we can expect bullish divergence at any time which will lead the priceline between 0.382 to 0.786 Fibonacci projection of C to D leg , but if after this bullish divergence the candles sticks will be closed above the 0.786 Fibonacci projection area of A to D leg then it can also lead to the long term bullish move.
Buying And Sell Targets:
The buying and sell targets according to harmonic BAT pattern should be:
Buy between: $0.2050 to $0.1732
Sell between: $0.2301 to $0.2905
So this trade has potential to produce upto 67% big gains.
Stop Loss:
The potential reversal zone area which is up to to $0.1732 can be used as stop loss in case of complete candle stick closes below this level.






