
Hi guys, let's look at XRP from a long term perspective.
As you see in the weekly chart below, XRP has been following an upper descending trendline with lower highs.
It seems that it bottomed at 0.00004000 level. It tried to 6 time to go below this support level but it is rejected so far.
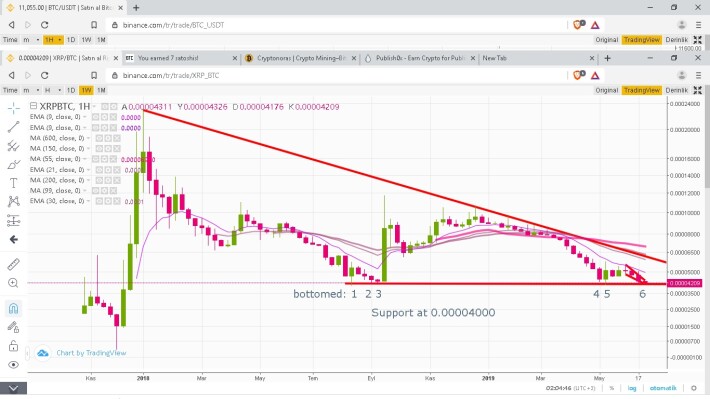
So, is this pattern a descending triangle chart pattern like this below? May be or may not.
We will confirm once we close below current support level.
If this is the case, prive will move down.

(ref: https://www.multiplierwealth.com)
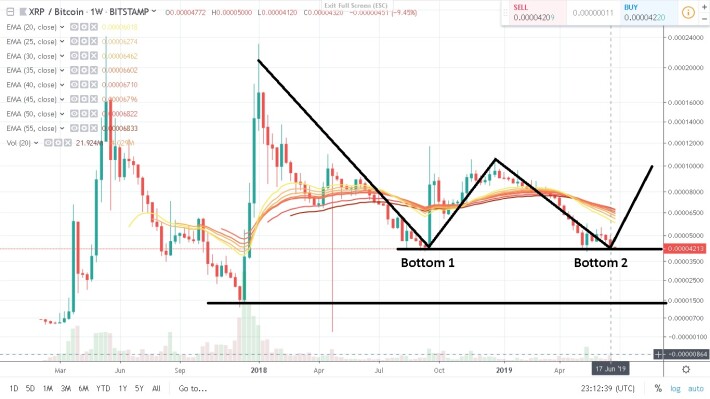
It can be a double bottom chart pattern. We will confirm once we reach the necline (0.001 level) without going below current support level.
If this is the case, prive will move up drastically.
Thanks for reading. I hope you’ve found it helpful.
If you like this content, tip me please with some DAI or use one of the addresses bellow:
*********************************
- to get free Bitcoin, go to adBTC website and https://multimining.website/signup?referral=1334
-- Sign up for Coinbase and get $10 Free Bitcoin:www.coinbase.com/join
--
Do not forget to download BRAVE browser and get BAT token ($5)
-- Get Free Verge (XVG), ByteCoin (BCN), Steem, Tron (TRX), Siacoin, Bean cash, etc. at theCryptoFaucet https://www.thecryptofaucet.com
-- Claim your Free BitcoincashABC here at https://www.free-bcash.comon this mobile app https://bitcoinaliens.com
-- Get Free Monero (XMR) hourl here at https://free-monero.com
For Donations:
BITCOIN: 1DaiEgPxzzud6giRWzwyiQQ7pNpQ99QrxL
ETHEREUM: 1DaiEgPxzzud6giRWzwyiQQ7pNpQ99QrxL
Publish0x: https://www.publish0x.com?a=1YQdJWyeOG
To go to Binance: www.binance.com