
Using golden ratio multiplier, is it possible to detect the tops of Bitcoin in a bull run. Historical data shows yes. Look at the BTCUSD chart below.
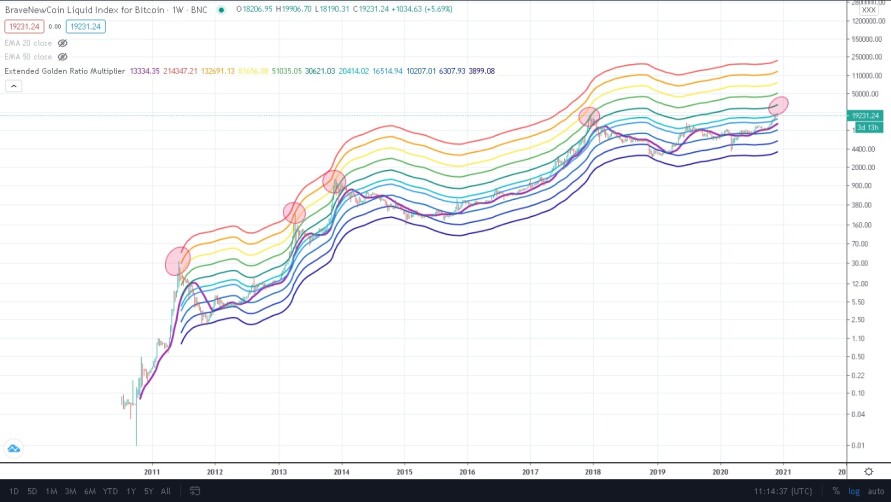
Extended golden ratio multiplier shows that in the first bull run un 2011, Bitcoin price reached the pink line, in the second bull in 2013, it topped at the red line, in 2014 it topped in yellow line, in 2018 it topped at the green line so, what's next?
According to this indicator, Bitcoin will reach $30475 as of today. But these lines have been increasing over time.
How can Golden Ratio Multiplier detect tops in Bitcoin?
This indicator is outlined in The Golden Ratio Multiplier: Unlocking the mathematically organic nature of Bitcoin adoption
This indicator uses the 350 day moving average (350DMA)) since It has historically been an important moving average because once price moves above it, a new bull run begins. This indicator multiplies 350DMA) by the numbers in Fibonacci Sequence.
In that way, we can pick out each of Bitcoin’s market cycle tops going all the way back to the first price bubble in 2011.
350DMA x21 = 2011 top
350DMA x13 = 2013 top
350DMA x 8 = 2014 top
350DMA x5 = 2018 top
So, the indicator will enable us to detect accurately and consistently intracycle highs and lows for Bitcoin’s price, and most importantly forecast when Bitcoin will top out in the coming market cycle.
Thanks for reading. I hope you’ve found it helpful.
*********************************
-- Want to Earn free Bitcoin?
s ** Go to Cointiplyat http://cointiply.com/r/j38la and claim Bitcoin every hour (Don't forget to use the twitter promo code that is given by @CointiplyFaucet)
** Go to adbtc.top, one of the easiest and fast Bitcoin accumulating web sites
-- Sign up for Coinbase and get $10 Free Bitcoin:www.coinbase.com/join
Sign up to Binance Exchange: www.binance.com and start trading.


