
Bitcoin (BTC) has finally broken out, and how? The price shot through $ 10,000 to $ 11,600 and now seems to want to consolidate there. Has the bull market finally started or are we going to consolidate for a while? Has Bitcoin finally earned 'safe haven' status, as Bitcoin moves with gold and silver, while the dollar's value deteriorates? Let's look at the expectations regarding the Bitcoin price.
Daily chart Bitcoin rate
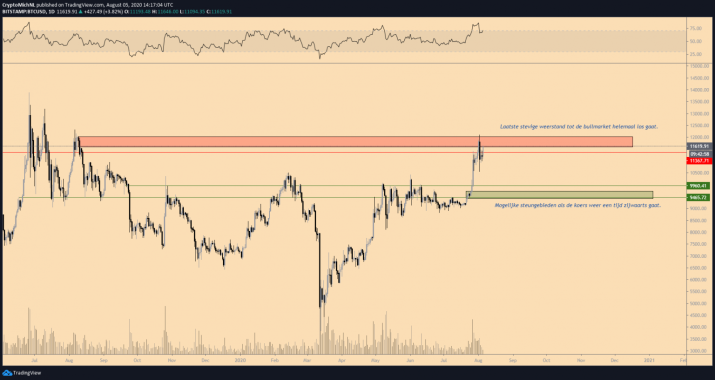
The daily chart clearly shows that there has been a break from the $ 10,000 psychological point. This compression and sideways movements took several months to break out. The longer something like that lasts, the more intense the movement is and the market has seen that. The price went from $ 9,500 to $ 11,600 in one spurt.
What does the graph indicate? At this point, it is up against the last major resistance before the full bullmarket goes wild. It is not expected that the price will do this in one go, so it may be considered more likely that sideways movements will take place for a while.
What are the levels to watch? The $ 9,500-10,100 area is an important one to keep an eye out for possible tests of the previous resistance. Often a resistance is tested back to confirm it as support, before the price moves further upwards to new highs.
Total market capitalization crypto

A very clear breakthrough in the resistance level at around $ 280-290 billion and pushing towards the $ 350 billion area.
It is unlikely to be broken right away from such a move, turning the areas around $ 280-290 billion into key areas for potential aid.
What are the resistance levels if the total market cap does take hold? The next area of resistance will then be $ 430-470 billion.
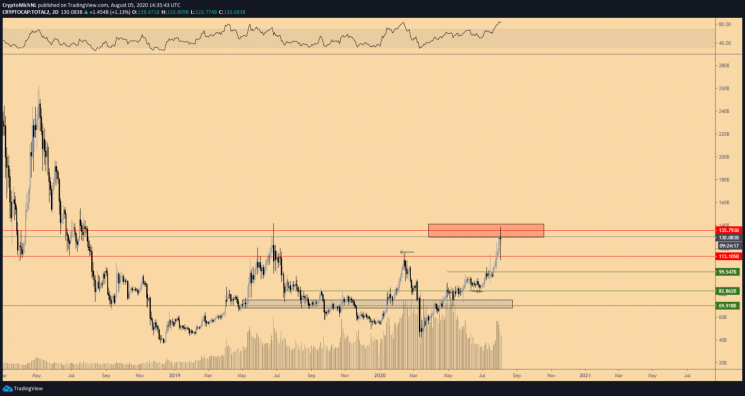
The total altcoin market cap is also in resistance territory as the altcoin market cap has broken through the $ 100 billion level.
What is the most plausible? For this graph too, a sideways movement will be reasonably plausible. A breakthrough in this resistance level will make $ 200 billion an opportunity, but as stated earlier, this is not expected to happen all at once.
45-minute chart Bitcoin rate
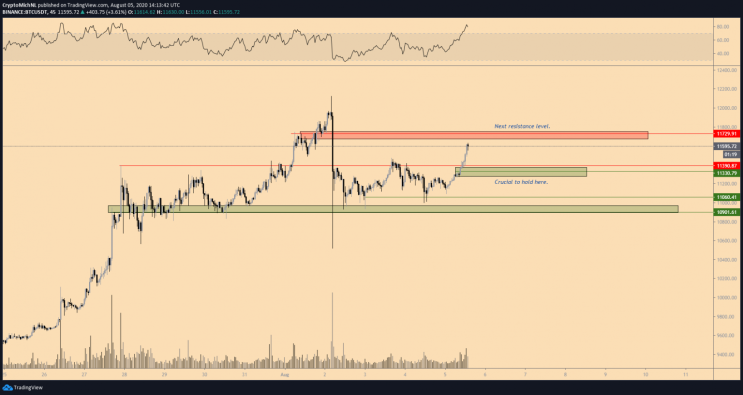
On the lower timeframes, the Bitcoin rate looks like this. It is unlikely that a strong impulse movement is coming (but hey, even silver is surprising us with extreme forces upwards).
The price broke through the $ 11,300-11,400 level and found strength from there to continue towards the next resistance level at $ 11,600-11,700.
This is the last essential level before the Bitcoin price can start making a new impulse movement and setting new highs. The question then is how high the price will go and whether we can go to $ 15,000 in one go.
However, should the price fall below the USD 11,300-11,400 level, a drop to USD 10,900 and below is a very plausible scenario. After all, there is also a CME gap open at $ 9,600.
Exciting and Volatile Times! Thanks for reading and see you next time!


