Ethereum(ETH) vs Tether(USDT)
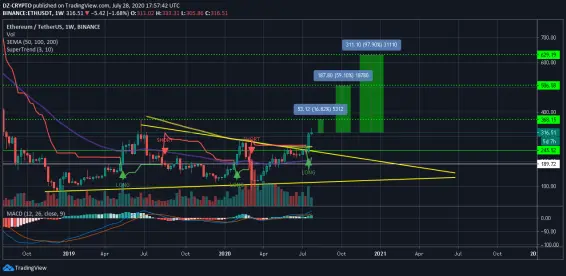
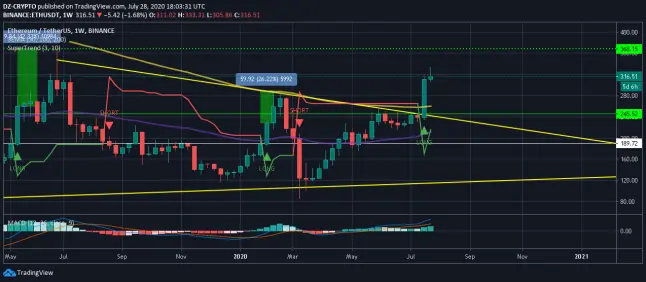
On the weekly chart Ethereum(ETH) breakout the Descinding triangle and give us another chance to see it in the point $629, Ethereum(ETH) formed the Descinding triangle in 27 Jun '2019 the price of Ethereum(ETH) was $346 . The 3EMAS (50,100,200) is Bearish but don't worry because when we take a look in the 3Day chart we see that Ethereum has break the EMA200( Gray Line ) and this will and an open ended of the Bearish so the 3EMAS will going to be Bullish .
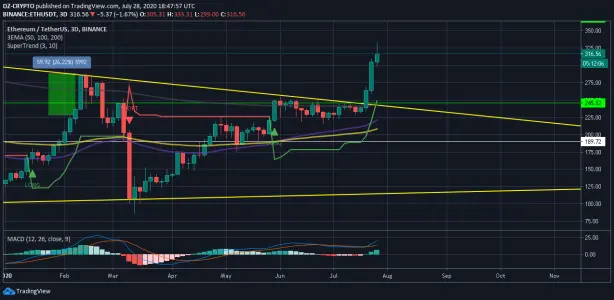
another better indicator who gives us a strong signals called "SUPER TREND" is LONG in the weekly chart . Ehereum(ETH) can make a big rise to $629 or with a few days or weeks .
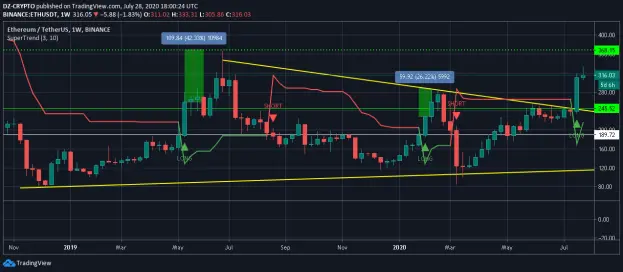
in the last 2 time the SUPER INDICATOR was LONG ethereum makes 42% profit in first time and 26% in the second time so i recommended to use this indicator it's so helpful for every beginner trader , The MACD is also Bullish since 9 may '2020.
Ethereum(ETH) vs Bitcoin(BTC)
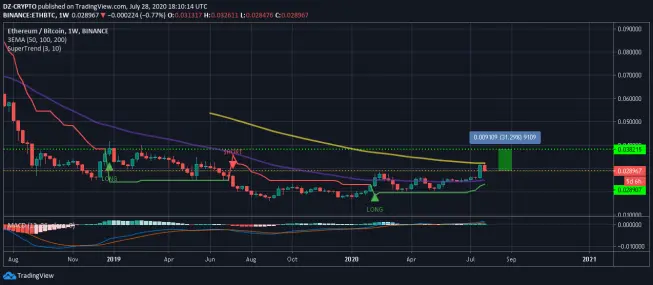
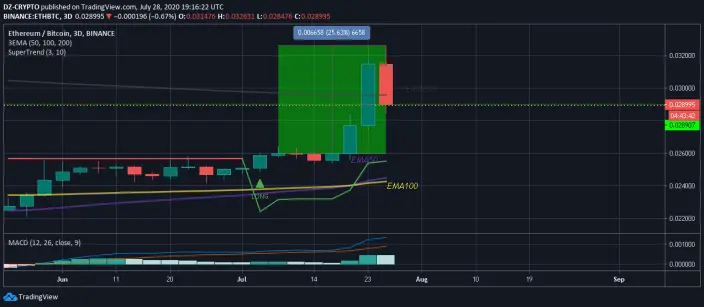
Ethereum(ETH) have a chance to get a profit of 31% (0.0382 BTC) according to the weekly chart and the 3 Day chart , Ethereum has break the EMA 50 in 10 Feb '20 and hit the EMA100 and today the price was returned to 0.0289 BTC , the MACD is bullish and the 3 EMAS is Bearish .
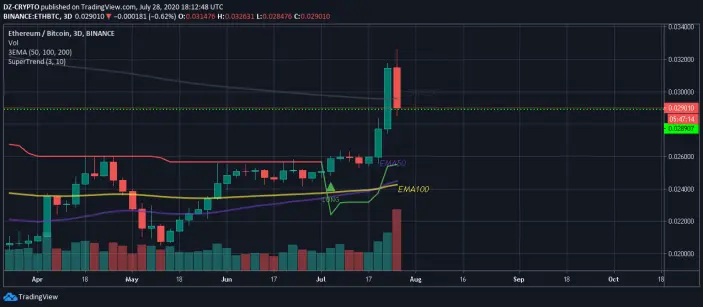
The 3 Day chart gives us a little to see Ehereum(ETH) rising again after the price has crossed up the EMA200 and also the EMA50 crossed up the EMA100 and open a road for the bullish way . the SUPER TREND was LONG 5 Jul '20 and gives a profite of 25% till this day .