
Today we talk too much about Bitcoin (BTC) in this article and we give you three analytics so please if you support us with little tips.
Bitcoin(BTC) Vs Tether(USDT)
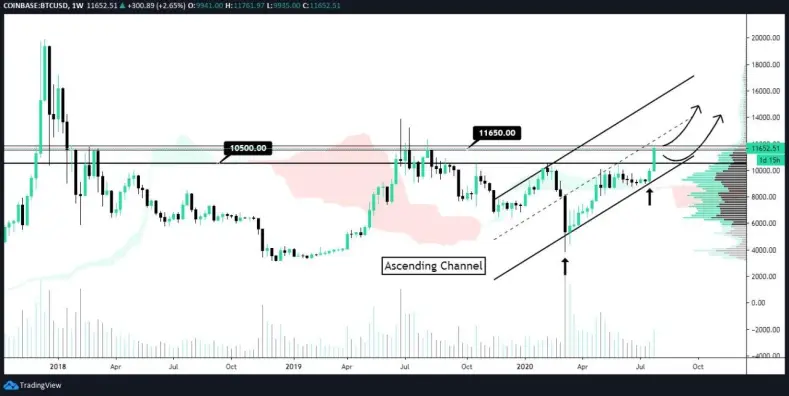
Bitcoin (BTC) the ranked 1st in coinmarketcap with over $213 Billion is now bullish broke out of the range and currently testing the horizontal resistance zone around 11650$. The breakout of such resistance will definitely push us higher; nonetheless we also might take a correction of this area.
Overall recommend to watch for the ascending channel we have on weekly as BTC is bullish while stays inside of this formation.
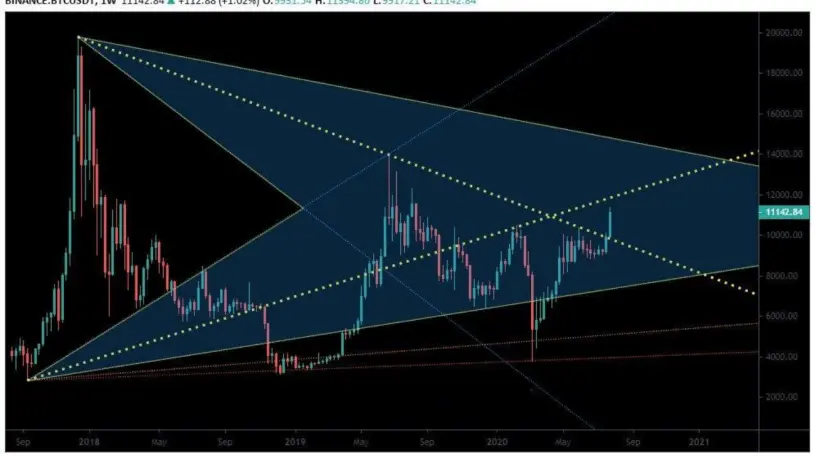
On the weekly frame, the first strong resistance targeted by the Bitcoin is 11,850, and it corresponds to the time trend indicated on the yellow chart.
The weekly closing should be above 11600 until the Bitcoin proceeds to the remaining targets, respectively
12,750 - 13,650 - 14,600 - 15,555
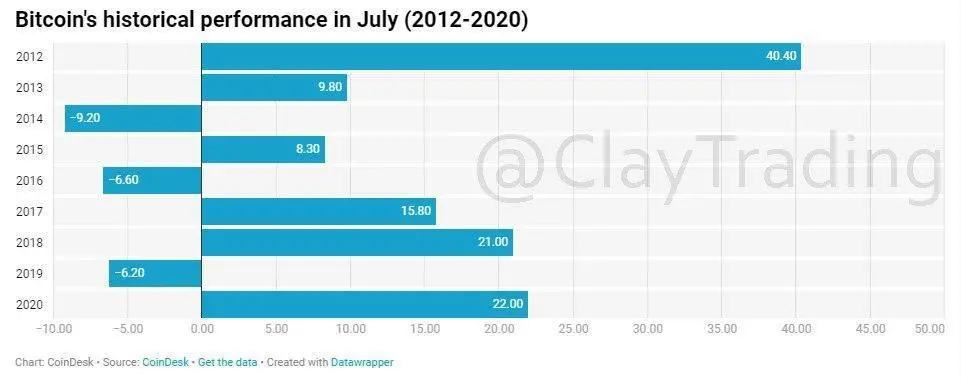
July can become most profitable month for BTC since the 2012. We only need to close daily candle above $11.145.
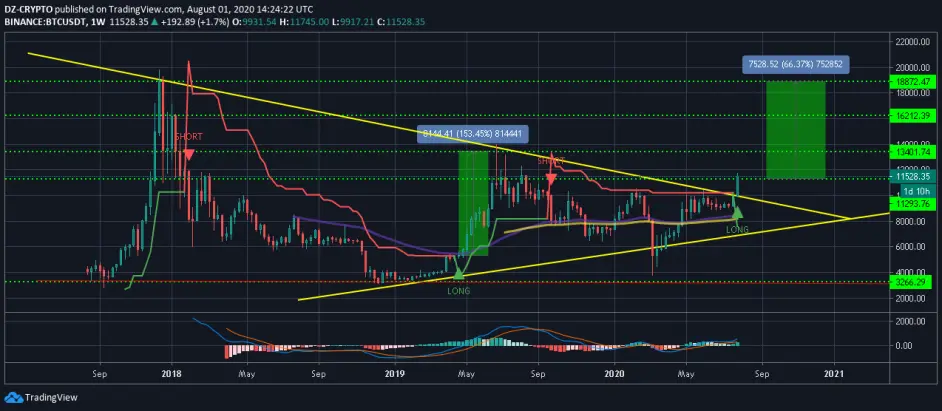
In this weekly chart we see that that all indicators is positive and set the stage for a possible major rise for Bitcoin (Up to 19k with profit of 66%), The MACD still Bullish since April 27th .
The three EMAS (50,100,200) is also bullish, now for The Super Trend indicator (I recommend it) is LONG since this week this gives up a gold signal maybe in the end of august Bitcoin will rise to the 19K maybe not but I suggest to follow the targets of the second analytic .
STELLAR (XLM) Vs Tether (USDT)
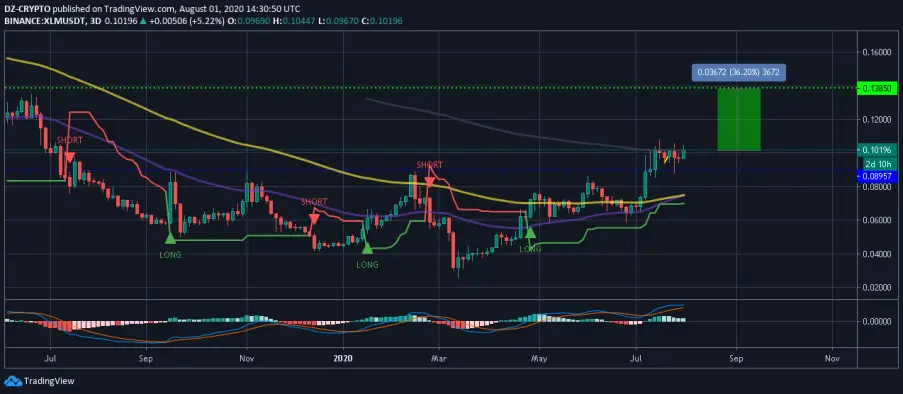
Stellar (XLM) the ranked 14th in coinmarketcap with over $2.1 Billion is trying to override the EMA 200 for chance to hit the point $0.138 and gives a profit of 36%.
Since September 16th, 2019 the coin moves between the resistance $0.89 and both supports $0.042 and $0.028, in july 14th 2020 XLM break this zone and give us a huge opportunity to see the coin surge up.
The MACD is Bullish also the 3 EMAS is going to be Bullish after the EMA 50 crossed up the EMA 100.
The Super Trend Indicator is LONG since April 27th





