
As Bitcoin's price momentum remains relatively bearish, alternative markets continue to struggle. Even the Tezos price is going down rapidly, albeit that was somewhat to be expected.
Tezos Price Momentum Sours
Less than 48 hours ago, it seemed as if Tezos would push for a new all-time high. Those hopes were quickly eroded when the overall momentum continued to sour for Bitcoin. Today, the price hovers near $3.40, but it may not stay there for too long.
It also seems that the overall XTZ trading volume is on the decline. Just $113 million in trades is nothing to get excited about. XTZ/USDT and XTZ/BTC remain the key pairings to keep an eye on. Some fresh money is flowing in through XTZ/USD on Coinbase Pro and XTZ/EUR on Kraken, however.
XTZ/USDT Technical Indicators
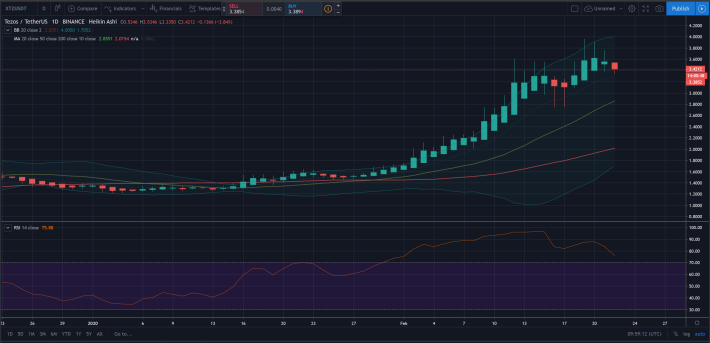
Bollinger Bands: Following the recent volatile market behavior, the XTZ/USDT Bollinger Bands are wide open. This seems to hint at more volatility throughout the weekend, primarily in a bearish direction. All of this will primarily hinge on which direction Bitcoin heads in. For now, that isn't looking too promising.
Moving Averages and RSI: Despite some market pressure, the MA20 and MA50 are still moving up rather nicely. There is no sign of a divergence to be found, thus no trend collapse will occur right away.
Today's red candle also has a little less "mass" to it, but the day has only just begun. The RSI is slowly retracing to neutral territory, indicating how some accumulation will occur.
Resistance Levels: The obvious resistance level is $3.40, as these "round" values often act as psychological barriers. Further pushback can be expected near $3.5 and $3.6139. Reaching those levels again may take some time, as weekends are usually anything but exciting.
XTZ/BTC Technical Indicators
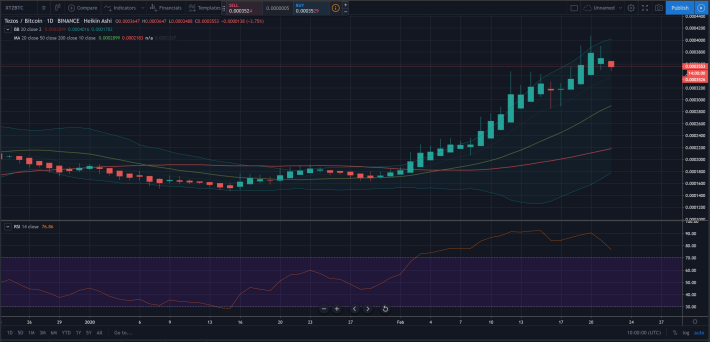
Bollinger Bands: No one will be surprised to learn how XTZ/BTC mirrors XTZ/USDT rather neatly. It too has wide open Bollinger Bands, and an increase in overall volatility seems very likely. Despite reaching a new high against Bitcoin this week, XTZ will likely keep declining in this ratio.
Moving Averages and RSI: No real changes here, as the MA20 and MA50 are moving up once again. With today's red candle shaping up strongly, there will probably be some more bearish pressure throughout the entire weekend. The XTZ/BTC RSI is also dropping to neutral territory once again.
Resistance Levels: The first resistance can be found near 3.544 Satoshi, as that is a pivotal point of sorts. Reaching 3,598 Satoshi again seems unlikely this week, albeit one never knows how these markets will evolve. The push to 3,631 Satoshi will not necessarily materialize again this week.


