
Polygon MATIC exceeded all expectations are broke through $2 overnight. With the token trading roughly 400% higher than just a month ago, we have to wonder, what's next?
Observing the price action as a series of pushes, we know that price movement comes in 3s and 5s. Elliott Wave theory is based on 5 bullish waves followed by a corrective pattern. Let's take a look at the 1H and see what waves we can pick up:
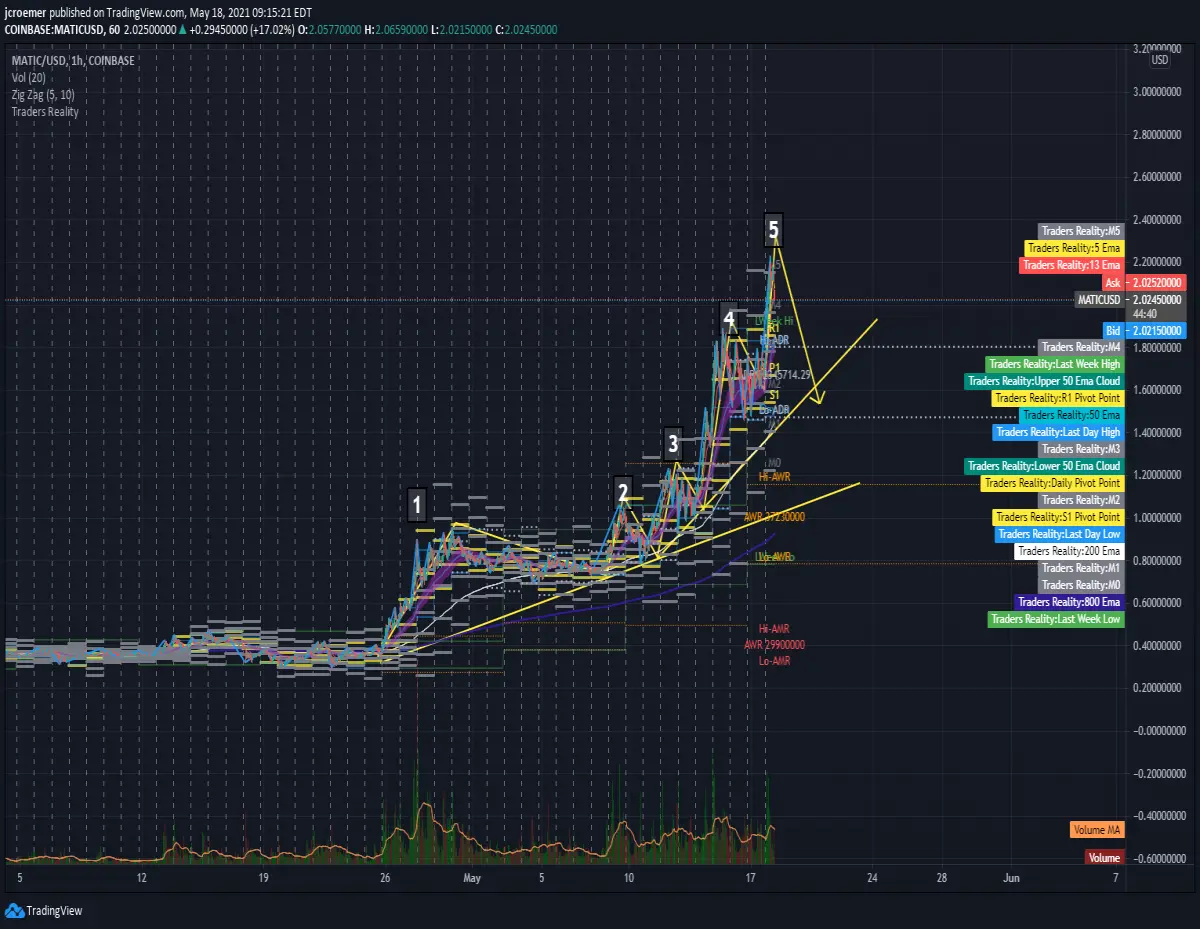
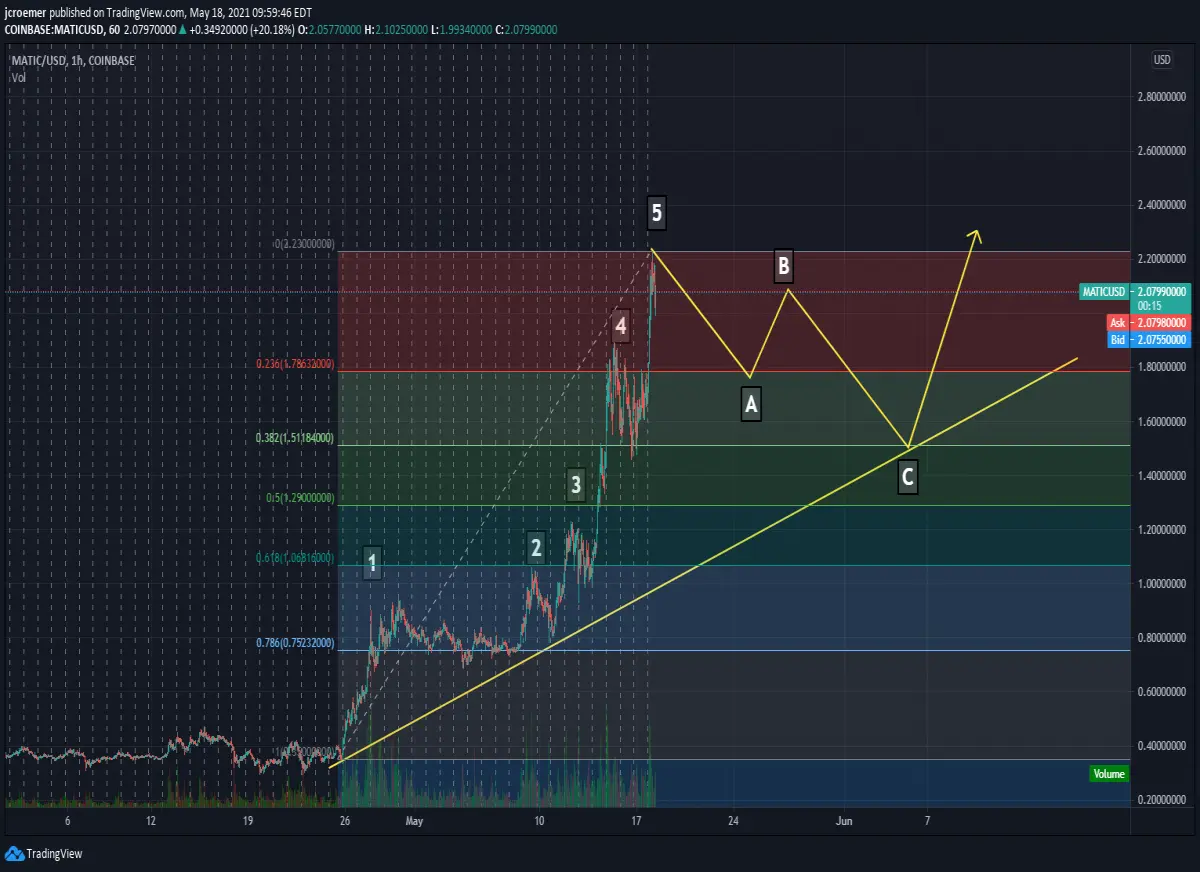
The push to $2.23 marked the fifth discernible breakout in the last month. This should complete the local bull cycle and send Polygon into a bit of an ABC corrective pattern. While it's difficult to watch gains dry up, the asset needs to cool off before it can heat back up. Driven by rounds of profit taking on 400% gains, price is going to need to find support, and after a rapid rise there tends to be a sharp fall. So let's see where the math leaves us.
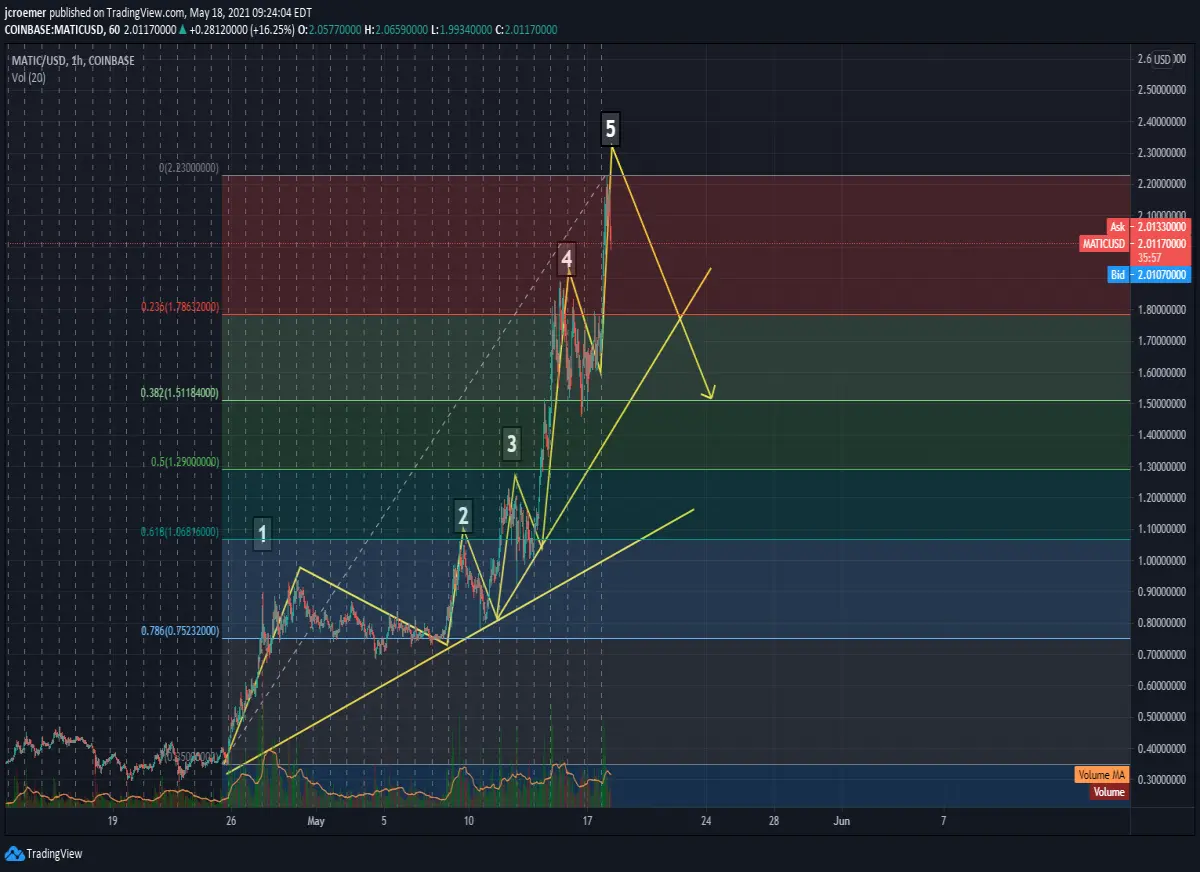
The first line of support is going to be 1.78. Should it break below 1.78, 1.51 would be next up on the .5 Fibonacci retracement line. That said, let's check out where the moving averages put us.
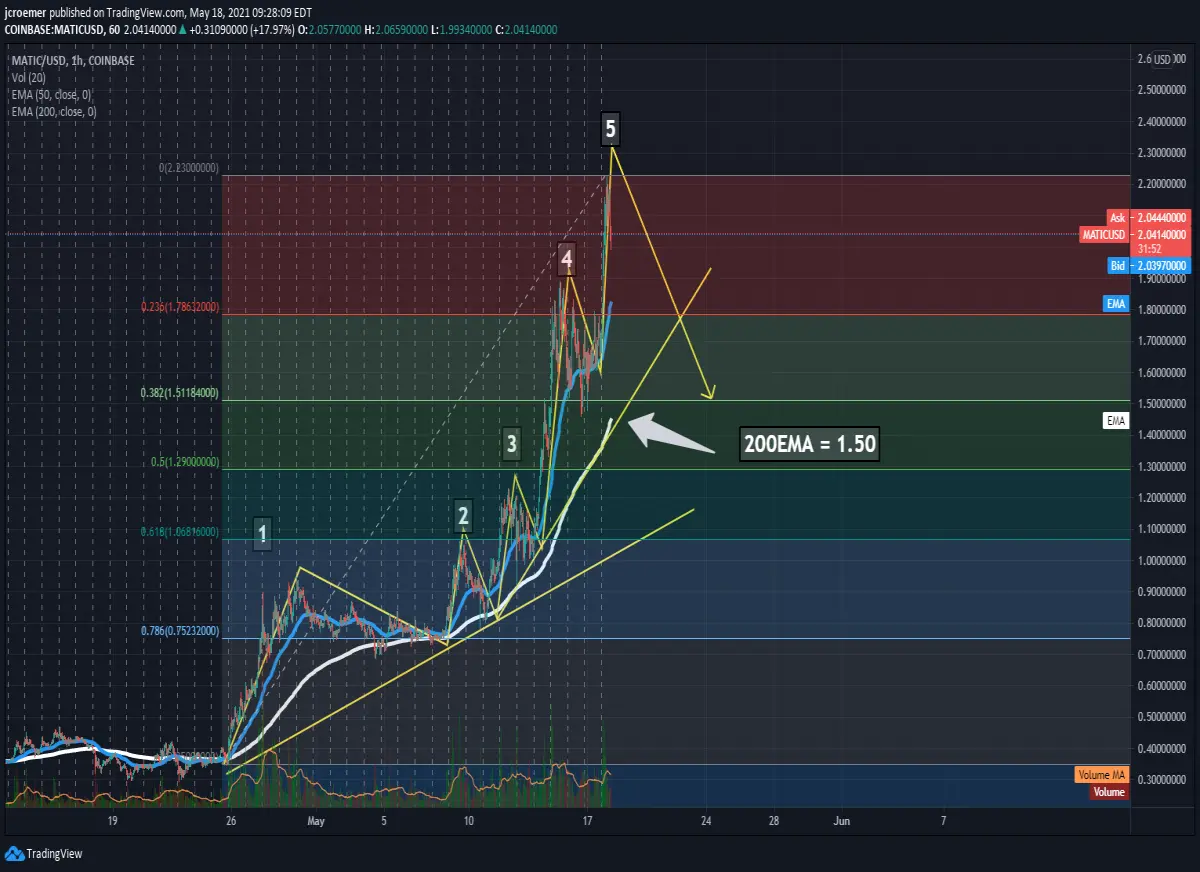
On the 1H, the 200EMA is about $1.50. Being that the 200EMA and the .5 Fib retrace meet at about $1.50, I'm going to be looking for some rock solid support here. We know that markets like to test moving averages and the 50EMA on the 1H is above the .236 retrace reinforcing how quickly price moved late April/early May 2021. It's silly to think that the market will not re-test the 50EMA after posting 400% gains in a month.
It's worth pulling back to the 1D and glancing at the oscillators.
 RSI is sitting at 86.86. A lot of folks would say this is overbought but Constance Brown and Trend ID strategy taught us that in bull markets, RSI oscillates between 40 and 90 so we can say that Polygon is rapidly approach the overbought zone. So here is the RSI chart adjusted for the Polygon bull market:
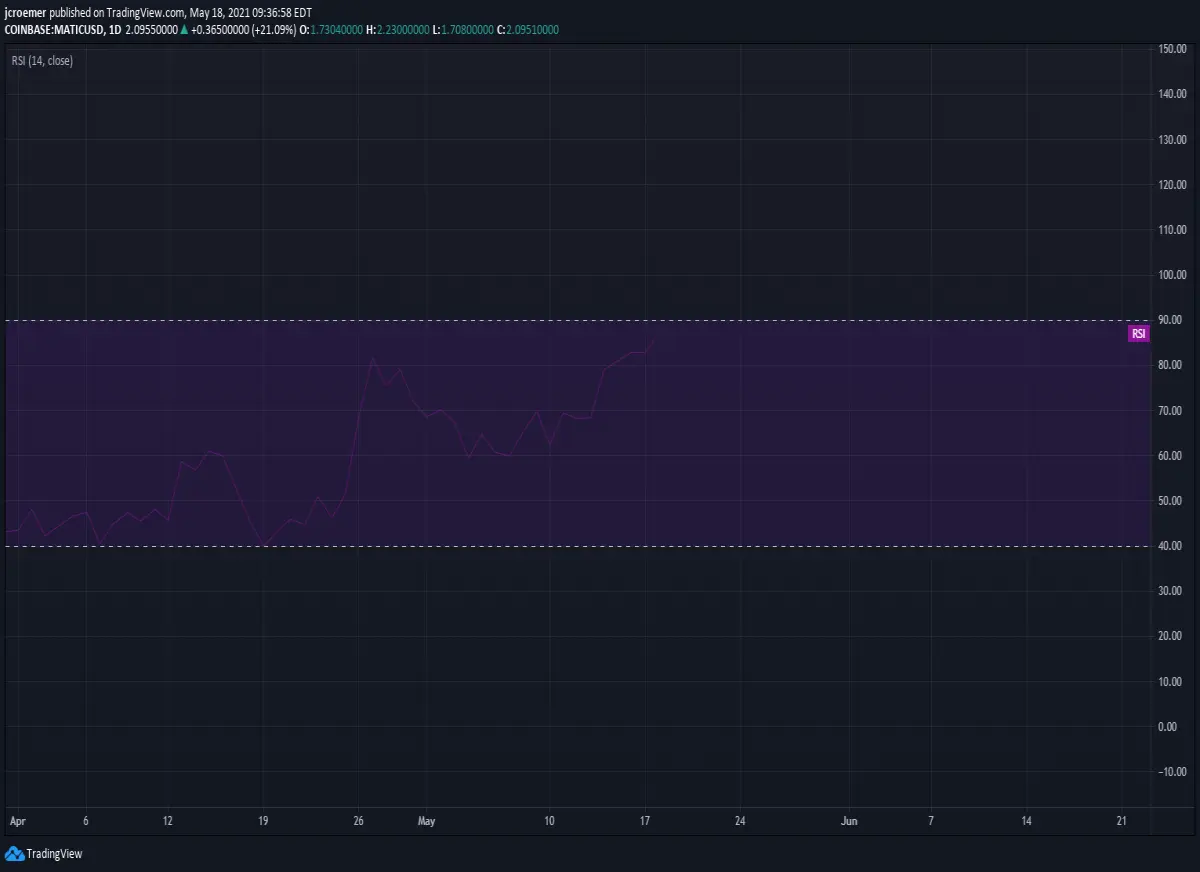
As you can see, Polygon's strongest rally, relatively speaking, on the 26th of April pushed RSI into a traditional overbought zone, and yet, price continued to break out.
The CCI is up to 220, fairly strong sell signal.
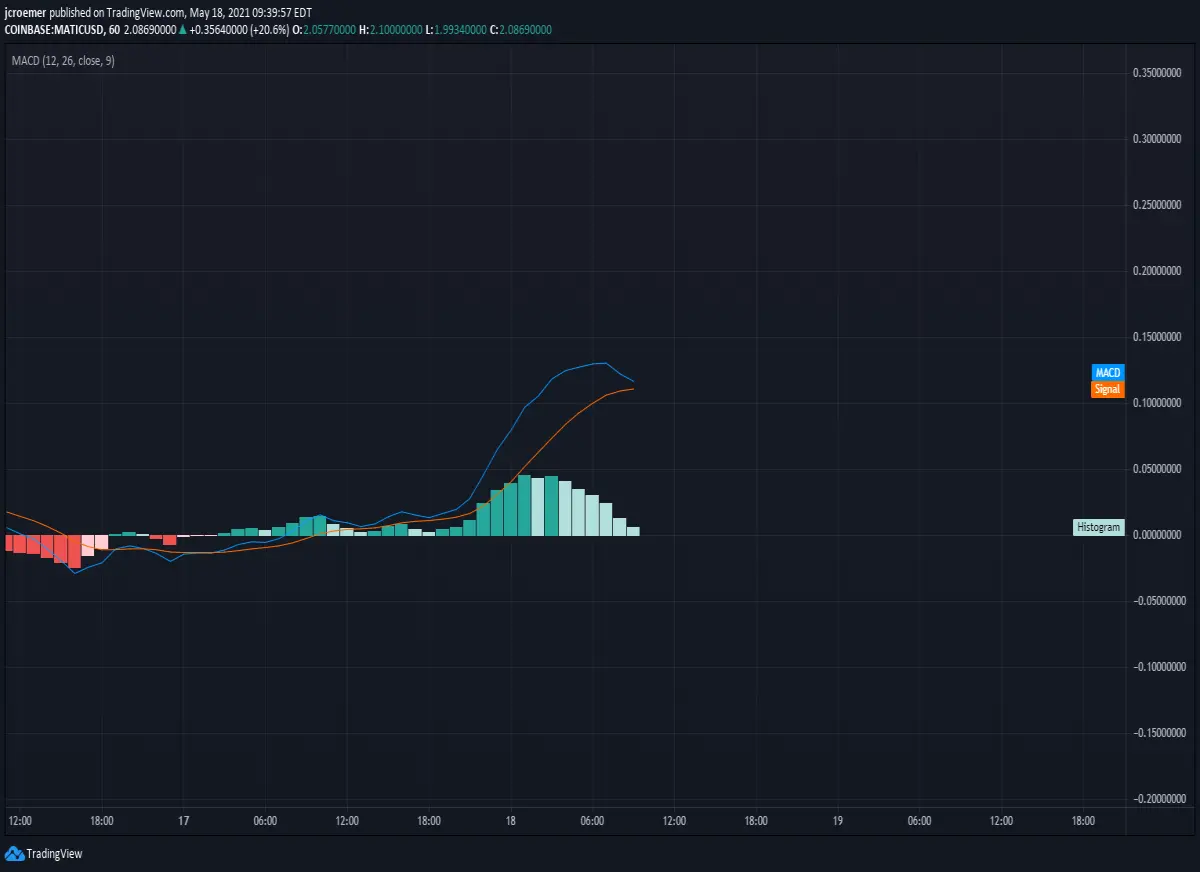
However, as you see above the MACD is still running strong but clearly the rally is starting to lose some steam as it shows up on the 1H zoom-in:
Looking ahead, the future is bright for Polygon. Fundamentally, investor sentiment is running very high on news that Polygon is forming an increasing number of partnerships to build on their Layer 2 solution for the Ethereum network. Users of the Polygon network have been leaving strong reviews, claiming that fees are minimal and transaction times are quite fast. Polygon MATIC is outgaining the closest competition, Cosmos and Polkadot. The price volatility in the Ether markets has driven demand for Polygon because Ethereum gas fees are out of control and economically just not feasible for most users. Mass adoption can not happen in those kinds of circumstances. Solutions like Polygon's Layer 2 network create the opportunity for Ethereum network to find mass acceptance.
We have seen some dramatic price movement in the old-school alt coin markets lately. The 400% return in one-month mark was recently met by a couple coins, Ethereum Classic in particular posting large gains and Doge being pumped. What happened after those coins saw 400% gains?
First up, ETC:
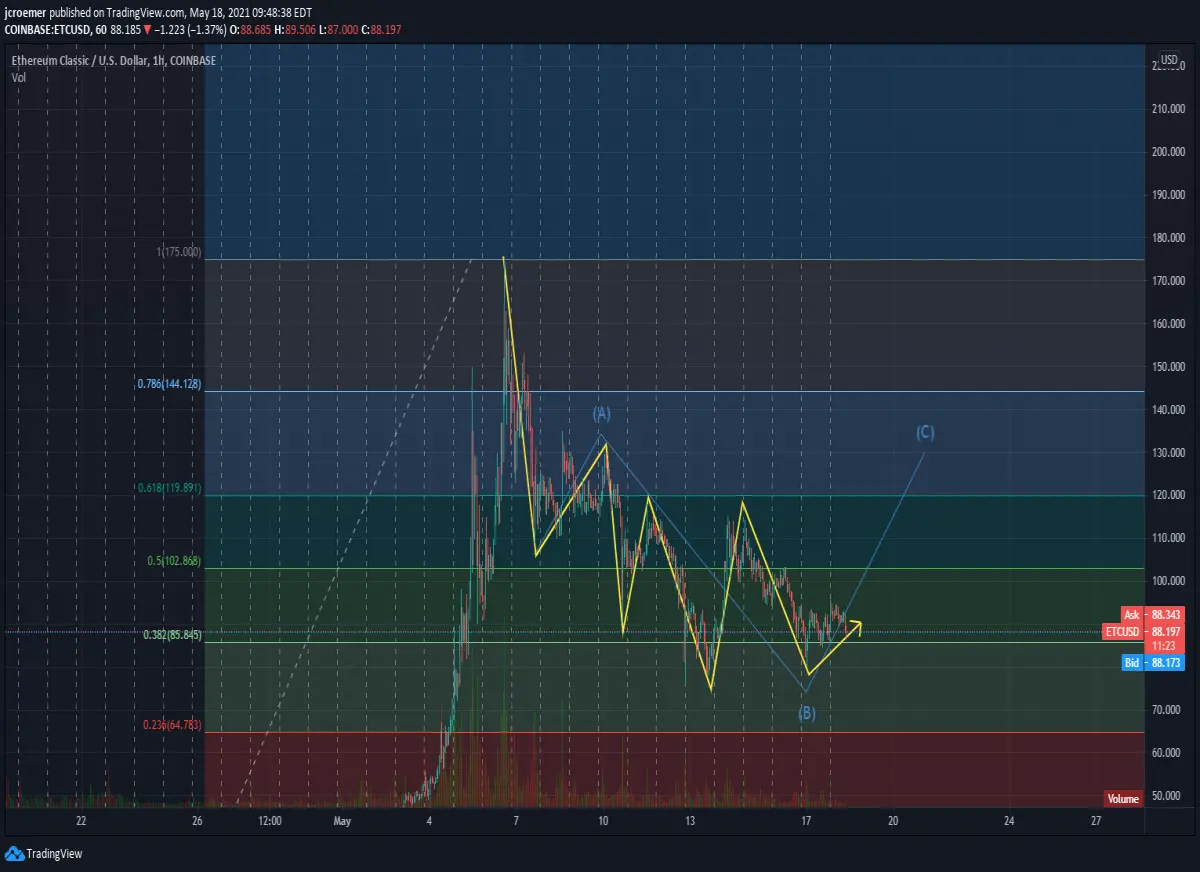
ETC retraced to its .382 Fib.
DOGE?
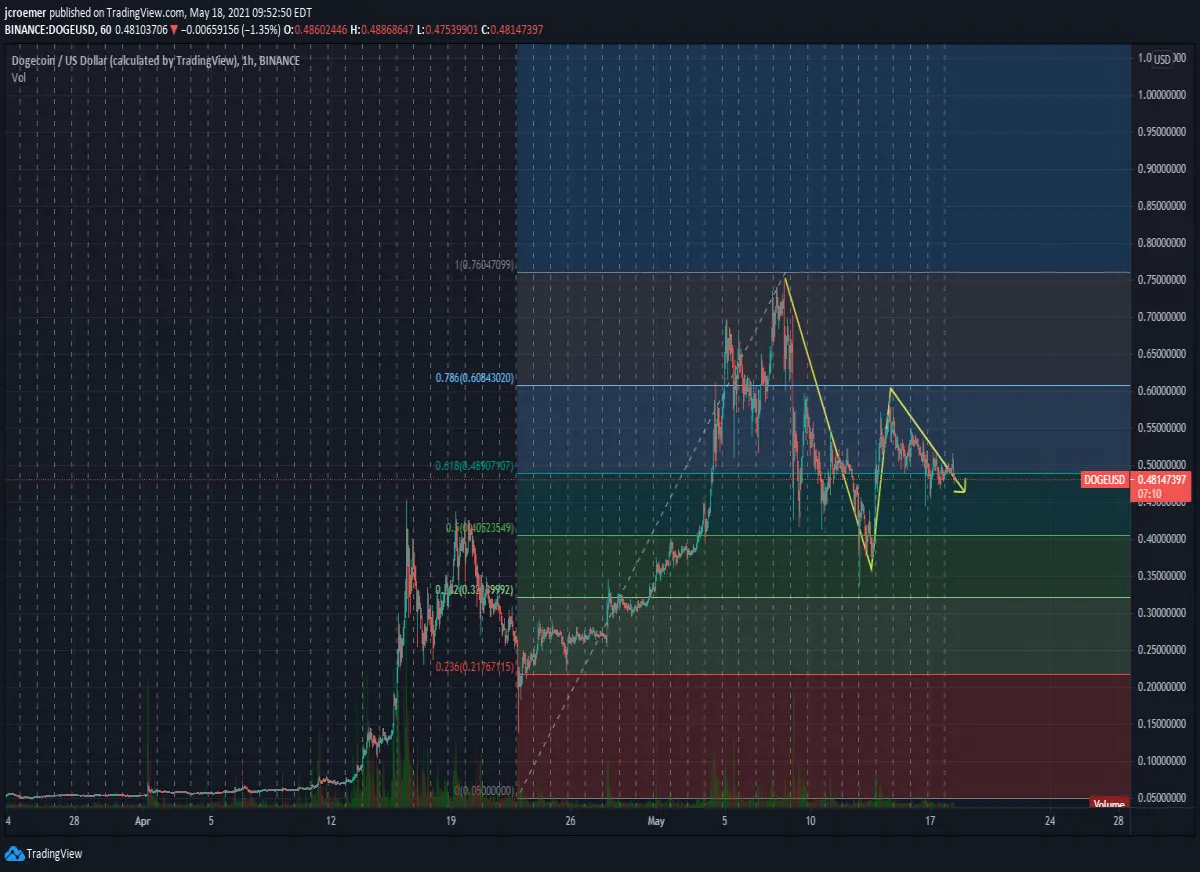
DOGE is fighting to hold the .618 retracement line after it briefly broke down below .5 and threatened the .382 line.
Both DOGE and ETC gave investors fits on the way back down where price is still struggling.
So what should we expect for Polygon MATIC based on this market data? I'm looking for price action to look something like this:
While it's never fun to watch price correct, this is part of a healthy market cycle which will ultimately produce larger gains. I still firmly believe that MATIC is locked in a larger bull pattern and that the future is bright, however, the short-term should provide those who are still on the sidelines some entry opportunities and also enable re-entry for those taking profits above $2.
We will like see a price drop in the near term to re-test Fib levels at $1.78 and $1.51 allowing for consolidation and accumulation. I'll be looking for a declining wedge to form through the early summer before the next major price breakout.
The 12-month target range remains $1.67 to $3.03 and up to $5.00.
*I hope you enjoyed this food for thought. This is a technical analysis, not financial advice. Always DYOR. If you've enjoyed this content, please tip the content creator.






