Bitcoin is forming an M across its 50EMA on the 1H chart as well as the 15M chart.
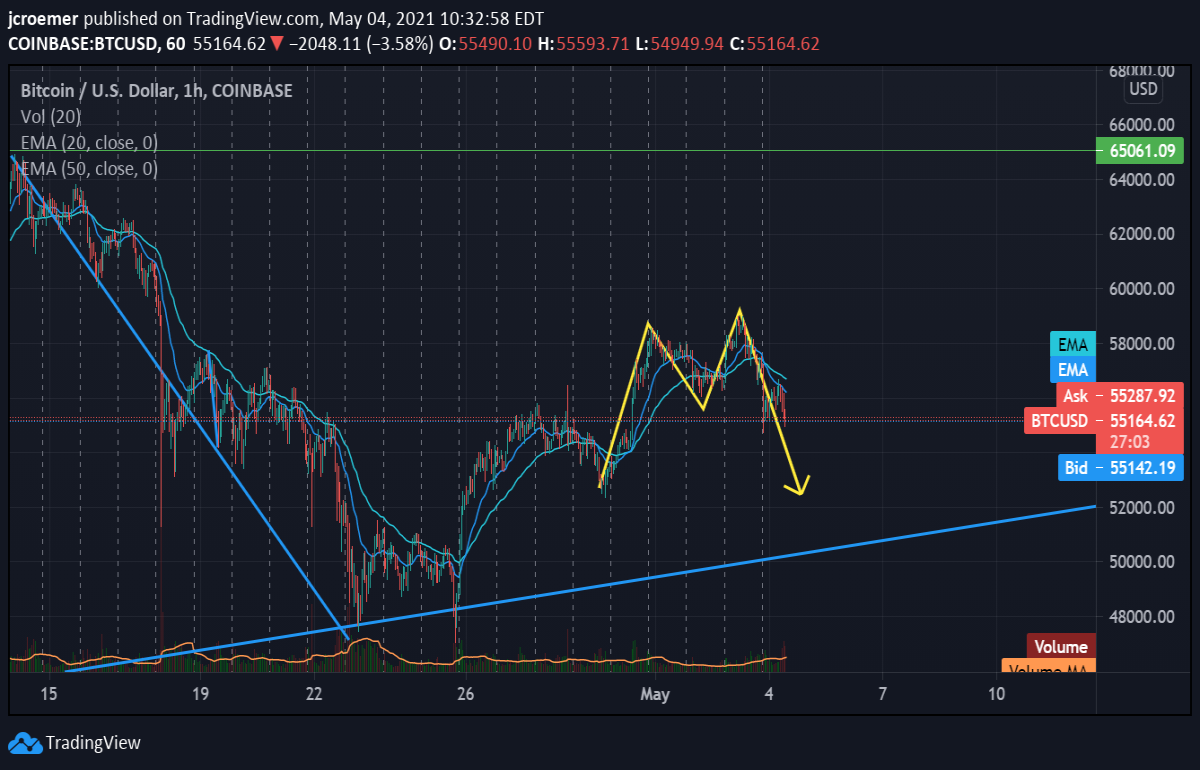
This pattern typically indicates a price reversal, however, with Bitcoin, it is equally likely that market makers are attempting to build longs before pushing price back to $60k. A further move down would retest support at the $52k-54k level, where it will most likely hold, albeit the asset could experience very short-term drops below the range as it did April 25-26 (above).
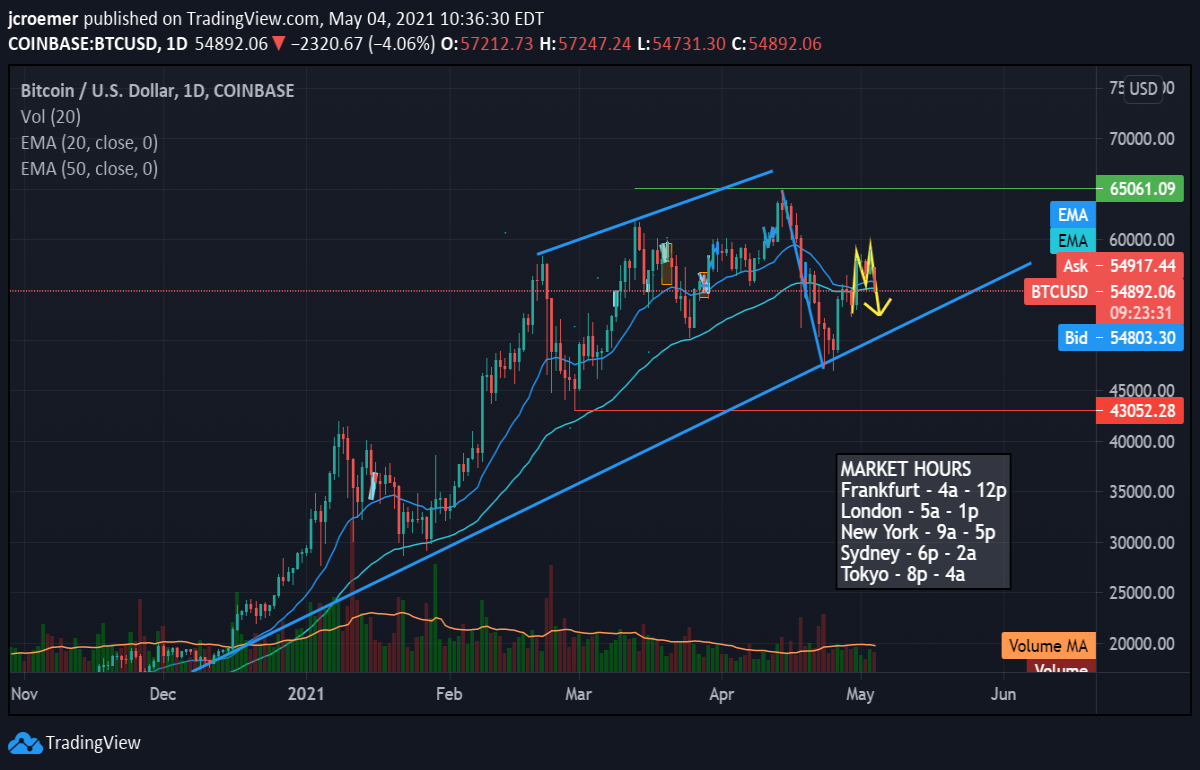
Pulling back to the 1D chart, we see that BTC remains in an overall uptrend with plenty of volatility. Would not be surprised at all to see a repeat of price action between April 22 and 26 before challenging $60k. It would be nice to see a close above $59,400 and for BTC to flip this long-held $58k resistance line into support.