
In the last article about XLM, we have seen that XLM might be going up a in parabolic path. For now, the price is slightly under the parabola, but we will confirm this in the next days (whether the price will bounce up the line again).
What I want to show in this short article is something I just spotted on the XLM/USD 4h chart. It is very hard to get reliable signals in technical analysis. Sometimes things go as expected, sometimes not. But look at the MACD in this chart:
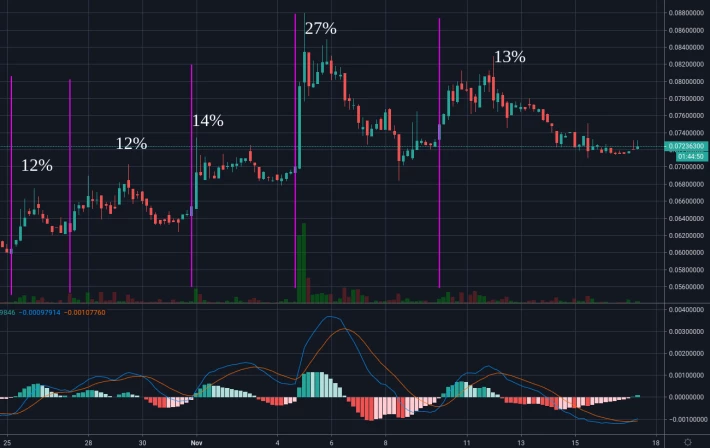
XLM/USD 4h chart and bullish MACD
Basically, the last 5 times that the MACD crossed bullish in the 4h chart, we have got from 12% to 27% increase in XLM's price. This would also put XLM back in the parabolic trajectory.

XLM on parabolic run?
Let's see how it turns out, and let me know what you guys think about this: is XLM really on a bull run?






