Created using Canva
Quick Crypto Season Check – Has Its Green Pulse Weakened?
My earlier article on Publish0x — After the October Crypto Crash: Is the Green Season Still Alive? — evaluated the ongoing Crypto Market season, exploring whether it has Bull Flavor or Bear Flavor.
Since then, the market has moved — and like weather changing by the hour, Total Market Capitalization (which tracks the combined valuation of all cryptocurrencies) has shifted slightly.
Yet, the macro analysis outlined in that earlier piece still holds relevance.
For those who missed that article, the outline sensed a bullish pulse beginning a new run after the loud Crypto Crash episode of Oct 7–10.
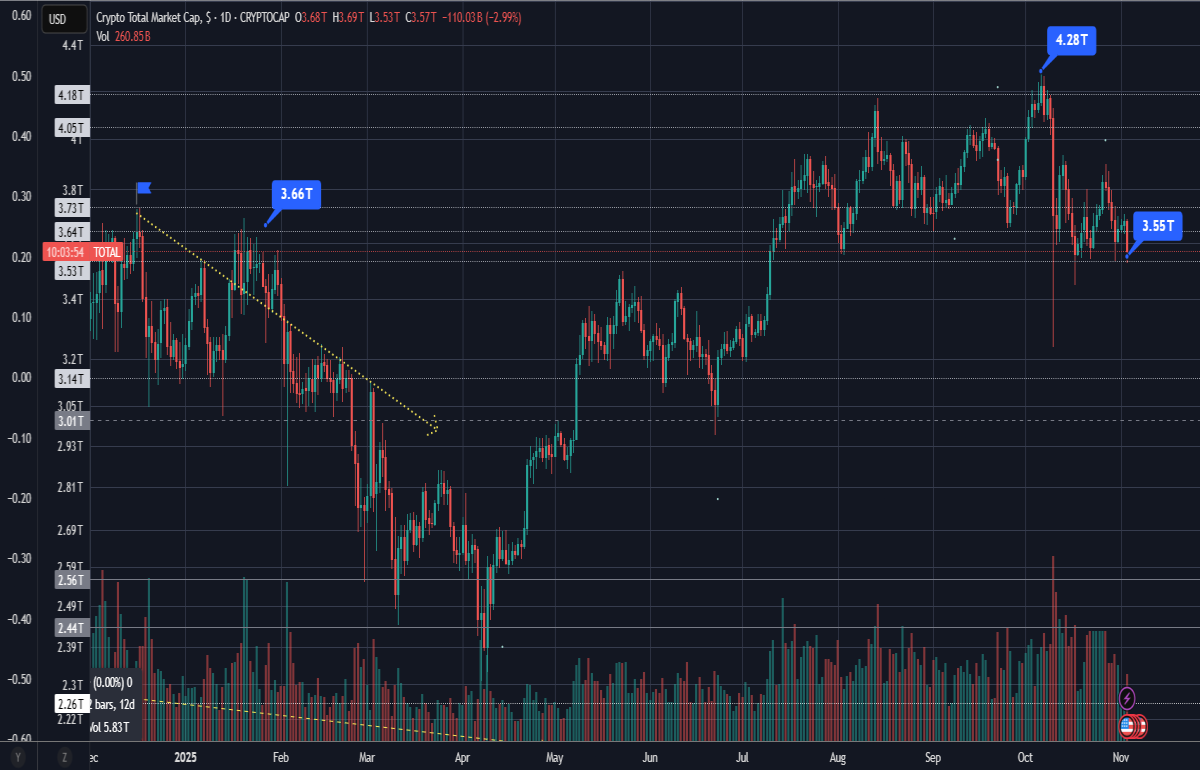
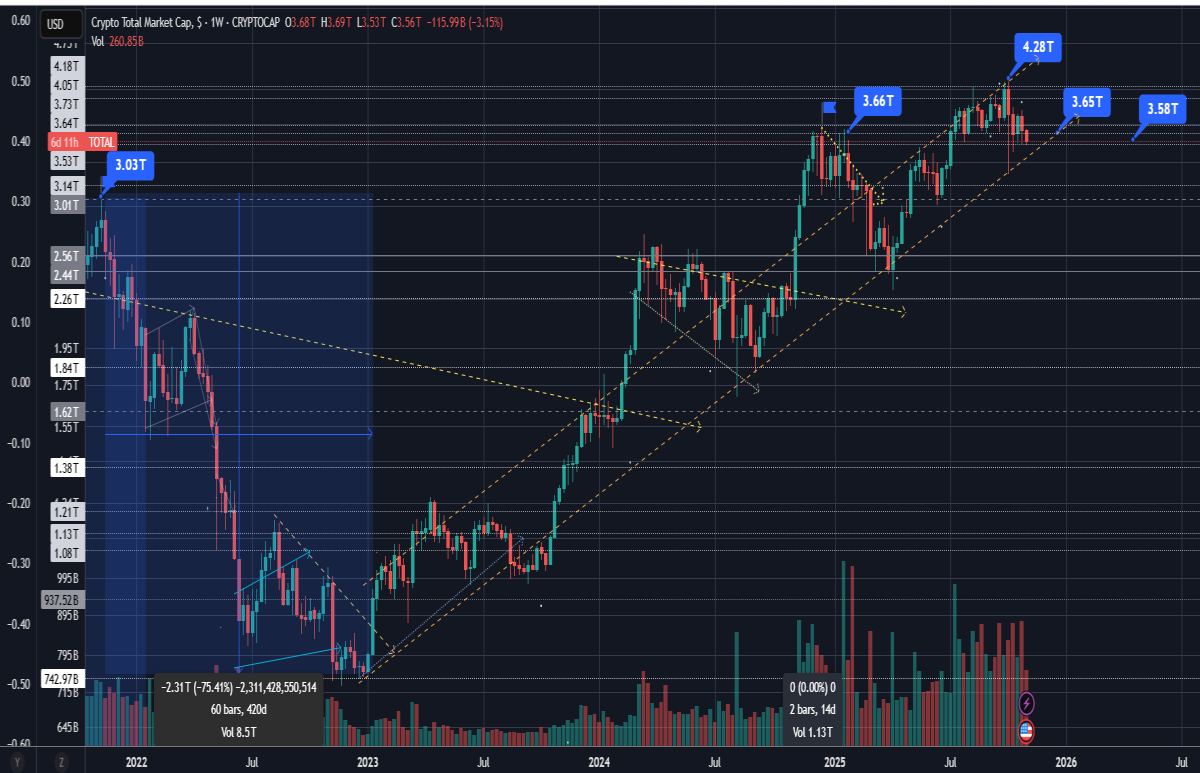
At that time, Total was looking to climb above $3.65T and form support — signaling recovery.
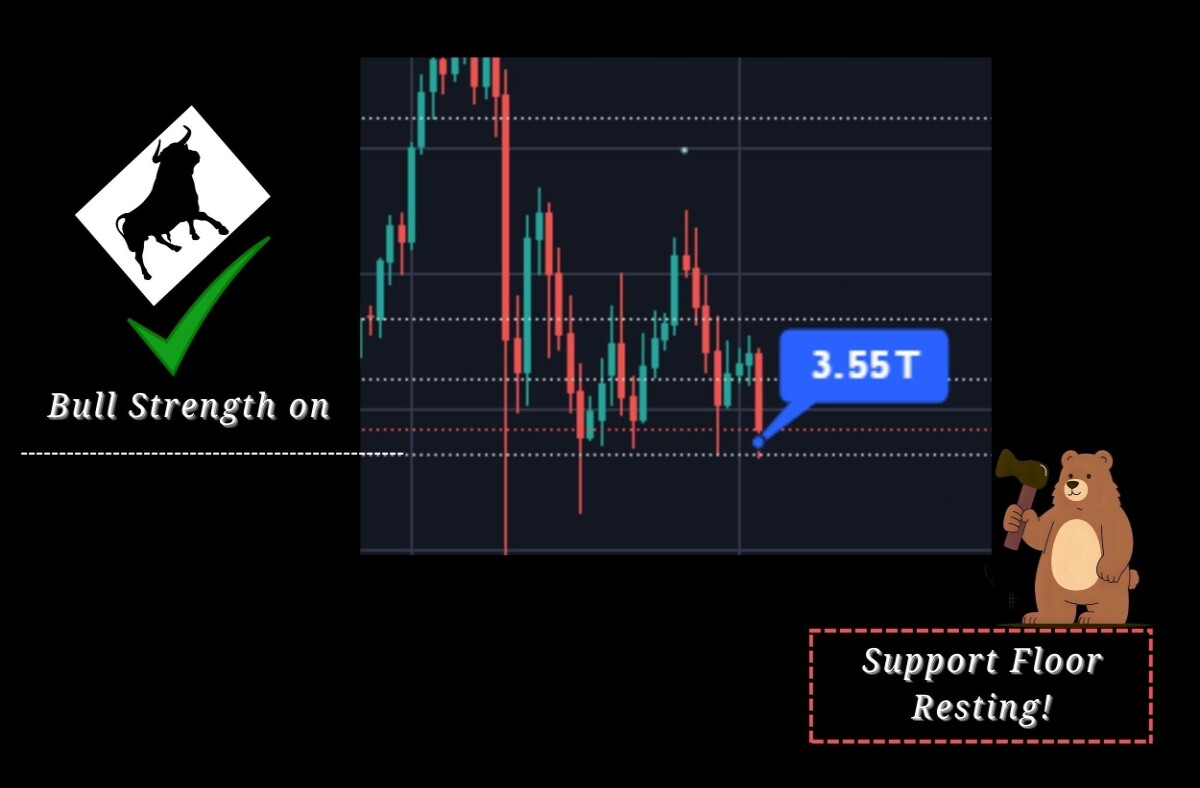
Total Tests Its Floor at $3.55T — Retesting the Ground for Further Bull Market Growth!
Created using Canva
The latest weekly candle shows a red rejection at $3.65T, but support remains firm at $3.55T.
This level now acts as the floor holding up the market’s bullish structure.
As long as Total’s valuation stays above this support, the overall Bull Market Structure remains intact.
The bull momentum is rebuilding again — that $3.55T floor is being tested by red candle wicks, but it’s holding.
This steady foundation forms the root zone for the next potential phase of the Crypto Bull Run.
Total’s Valuation Still Climbs the Ascending Bull Path
The broader Crypto Landscape’s Bull Structure remains visible on the weekly chart, where valuations have steadily followed an ascending trend line since January 2023.
These are the Bull Run Tracks — still aligned upward, maintaining the bullish rhythm of the crypto market.
The tracks, formed by rising support and resistance patterns, continue to uphold the Bullish Market Structure, with the pattern of higher highs and higher lows still playing out — signaling the continuation of Bull Market momentum.
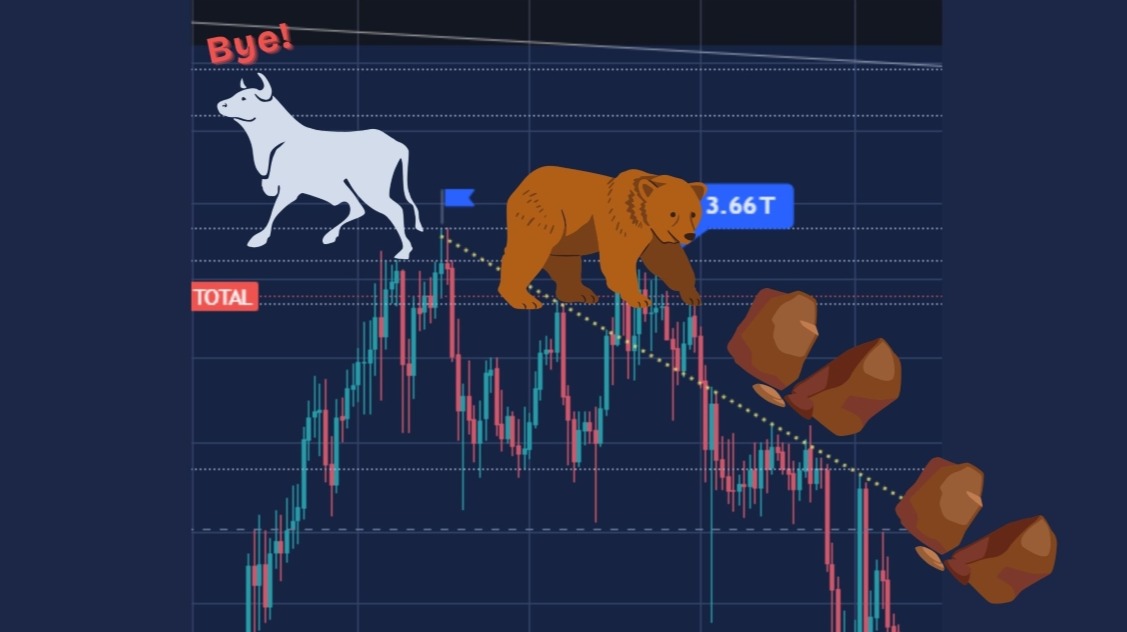
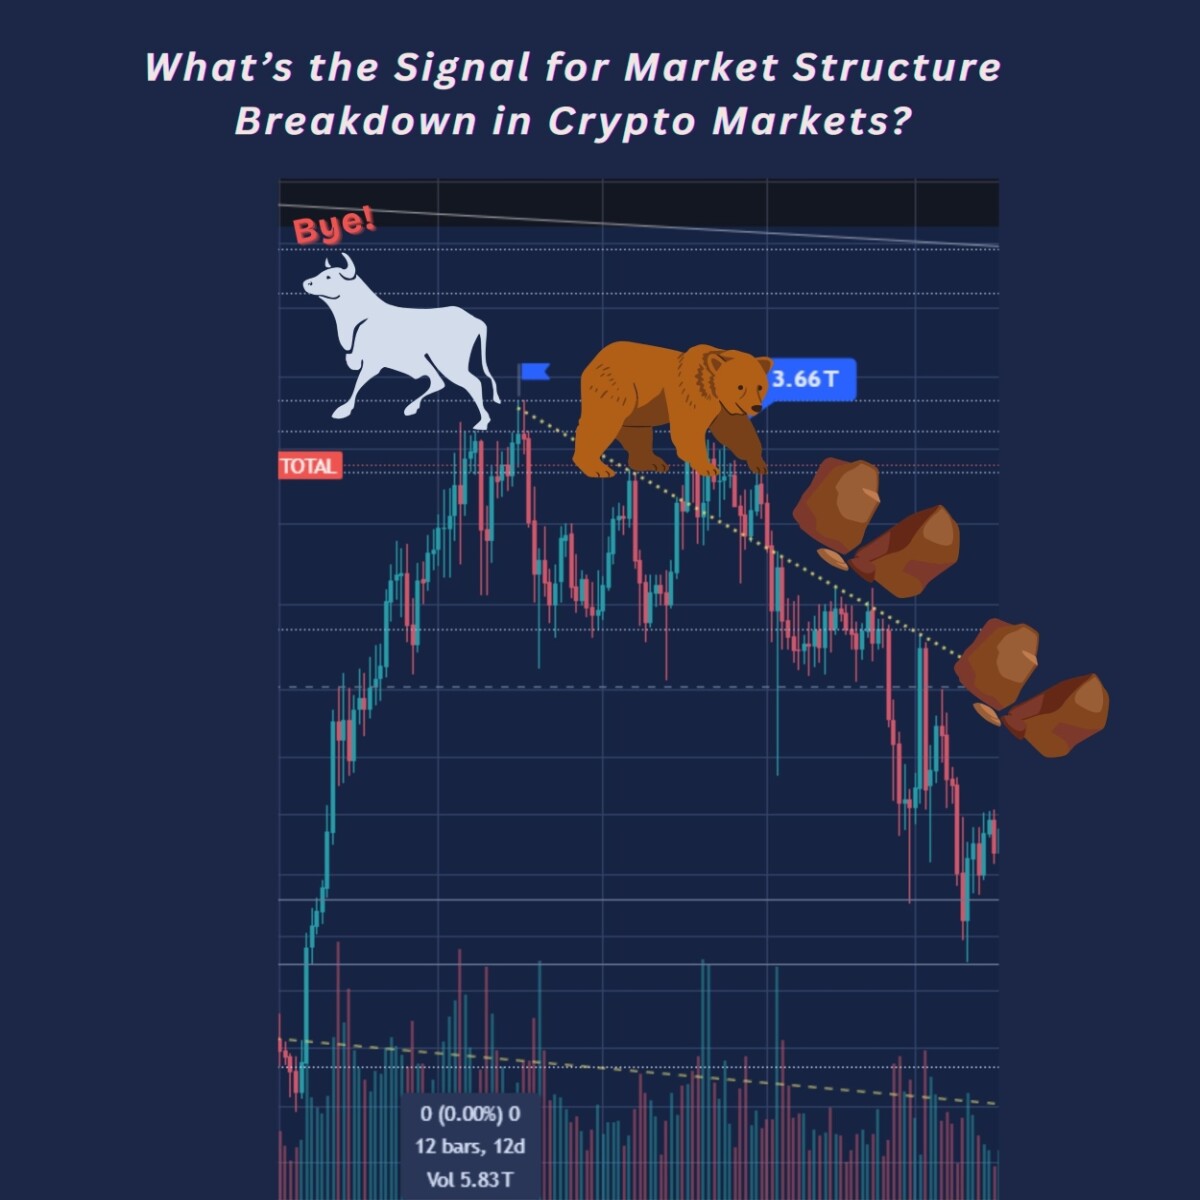
What Signals a Breakdown in Market Structure?
When price candles fall below the ascending bull channel in Total’s weekly chart, it marks the erosion of the current cycle’s strength — the point when the bulls approach their exit door.
The last bull cycle (Dec 2018–Nov 2021) peaked near $3.03T, and that level now forms the base rock for the current structure (Jan 2023–present).
If Total’s valuation drops and consolidates below $3.03T, it would indicate a macro structure breakdown — like the pyramid from The Mummy movie, with rocks tumbling as the foundation gives way.
Still, the market often plays with drama:
A false breakdown or quick rebound near this level could trigger a bull revival, sending valuations right back up the trend line.
Bull Cycle Still Shaping Its Slopes
This ongoing cycle (Jan 2023 onward) is still forming. The peak point hasn’t been made yet — only early slopes have risen above the previous cycle’s ATH of $3.03T.
Beyond this, market dynamics remain unpredictable, but the rhythm of Total’s trend tells us something important —
as long as the market stands above that $3.03T foundation, the Green Pulse still beats, and the bull story continues. 🌿
The market’s pulse is steady for now — but with every candle, the story of strength or surrender unfolds a little more.


