
Bitcoin (BTC) has reached a horizontal and Fib resistance at $41,325.
Ethereum (ETH), XRP (XRP), and Polygon (MATIC) are following descending resistance lines.
Aave (AAVE) and ChainLink (LINK) are trading inside short-term descending parallel channels.
ZCash (ZEC) has bounced at the $116 support area.
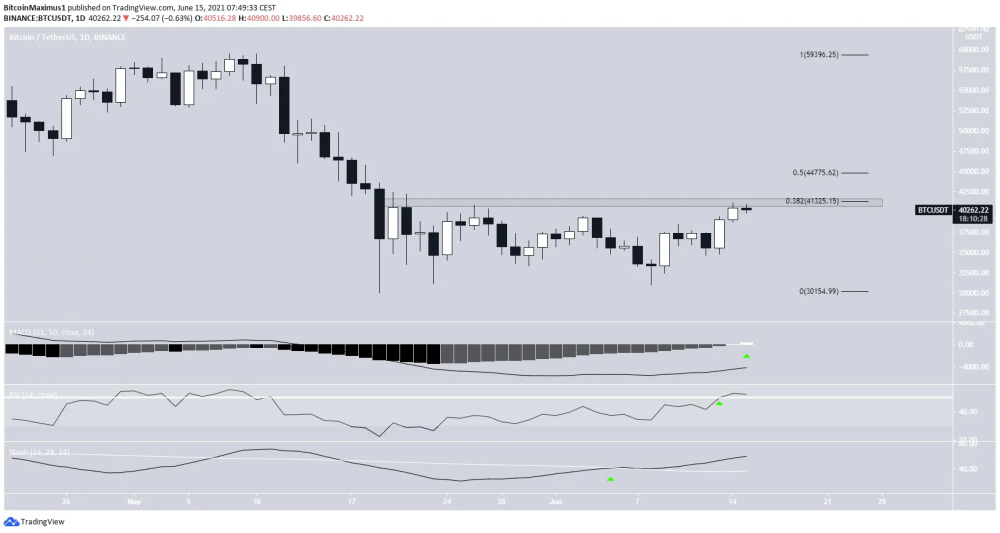
BTC
BTC created a bullish engulfing candlestick on June 13 and another smaller bullish candlestick on June 14. It managed to reach a high of $41,101 before decreasing slightly.
The main resistance area is found at $41,325. This is the 0.382 Fib retracement level and a horizontal resistance area. The next resistance above that is the 0.5 Fib retracement level at $44,775.
Technical indicators are bullish. The MACD has just turned positive, the RSI is above 50, and the Stochastic oscillator has made a bullish cross.
Despite this, a short-term pullback could occur prior to an eventual breakout.
ETH
ETH has been following a descending resistance line since May 19. The line has rejected the price five times up to this point.
ETH created its first higher low on May 30 at the 0.618 Fib retracement support level at $2,182. It’s possible that it has been following an ascending support line since, which in turn would create a symmetrical triangle.
The short-term MACD and RSI support a movement toward the resistance line and potentially could lead to a breakout.
Despite this, it’s likely that the longer-term trend is still bearish.

XRP
XRP has been facing resistance at $1.04 since May 20. Since June 1, it has also been following a descending resistance line, which has so far rejected the price three times.
On the other hand, the main support area is found at $0.80.
The six-hour MACD and RSI are both increasing, supporting the possibility of a breakout.
Therefore, it’s likely that XRP eventually breaks out and moves towards the resistance at $1.04.

AAVE
AAVE initiated a strong bounce on May 23 but has been falling since May 27. The decrease has taken the shape of a descending parallel channel, which often contains corrective movements.
On June 12, AAVE reached the support line of the channel and bounced. It’s currently attempting to reclaim the midline of the channel.
The short-term MACD and RSI are both bullish and increasing. Therefore, AAVE is likely to reclaim the middle of the channel and move towards resistance.

ZEC
ZEC has been increasing since bouncing on May 23. The bounce caused it to reclaim the $116 level, confirming it as support.
However, ZEC has failed to move above a short-term descending resistance line that’s been in place since May 19.
Following a rejection from this descending resistance, ZEC is in the process of creating a higher low just above the $116 support area. Doing so would be the first step in creating a bullish structure.
However, technical indicators are neutral. A breakout from the resistance line could take ZEC towards $197.

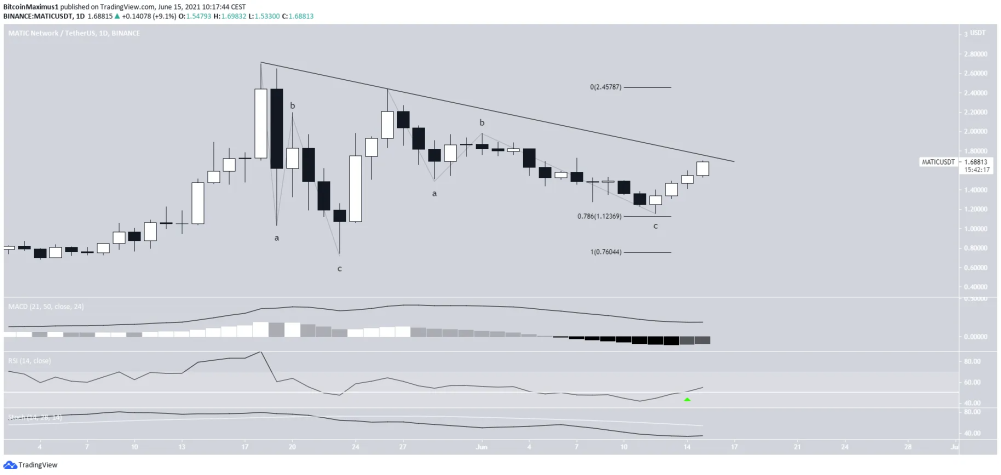
MATIC
MATIC has been decreasing alongside a descending resistance line since May 18. It created a lower high on May 26 and is currently making another attempt at breaking out.
The ongoing upward movement began after MATIC bounced at the 0.786 Fib retracement support level on June 12.
Technical indicators are providing some bullish signs, such as the RSI movement above 50 and the first higher momentum bar in the MACD. However, the latter has yet to give a bullish reversal signal and the Stochastic oscillator has not made a bullish cross. Therefore, a bullish reversal is not yet confirmed.
Despite this, both decreases since May 18 look like corrective A-B-C structure. Therefore, an eventual breakout is likely.
LINK
LINK has been decreasing inside a descending parallel channel since May 26 after it reached a high of $35.41. On June 12, it created a higher low and bounced at the support line of the channel.
It’s currently approaching the resistance line.
The MACD and RSI are both increasing, supporting the possibility that LINK breaks out. If so, the next closest resistance area would be found at $35.

What altcoins are you currently eyeing up and why? If you enjoy this sort of content, consider following me and also tipping the article.
Also if you are on Twitter, why not give me a follow and start some conversations? You can find me here - https://twitter.com/dizzlecrypto.
Until next time, stay classy crypto world!


