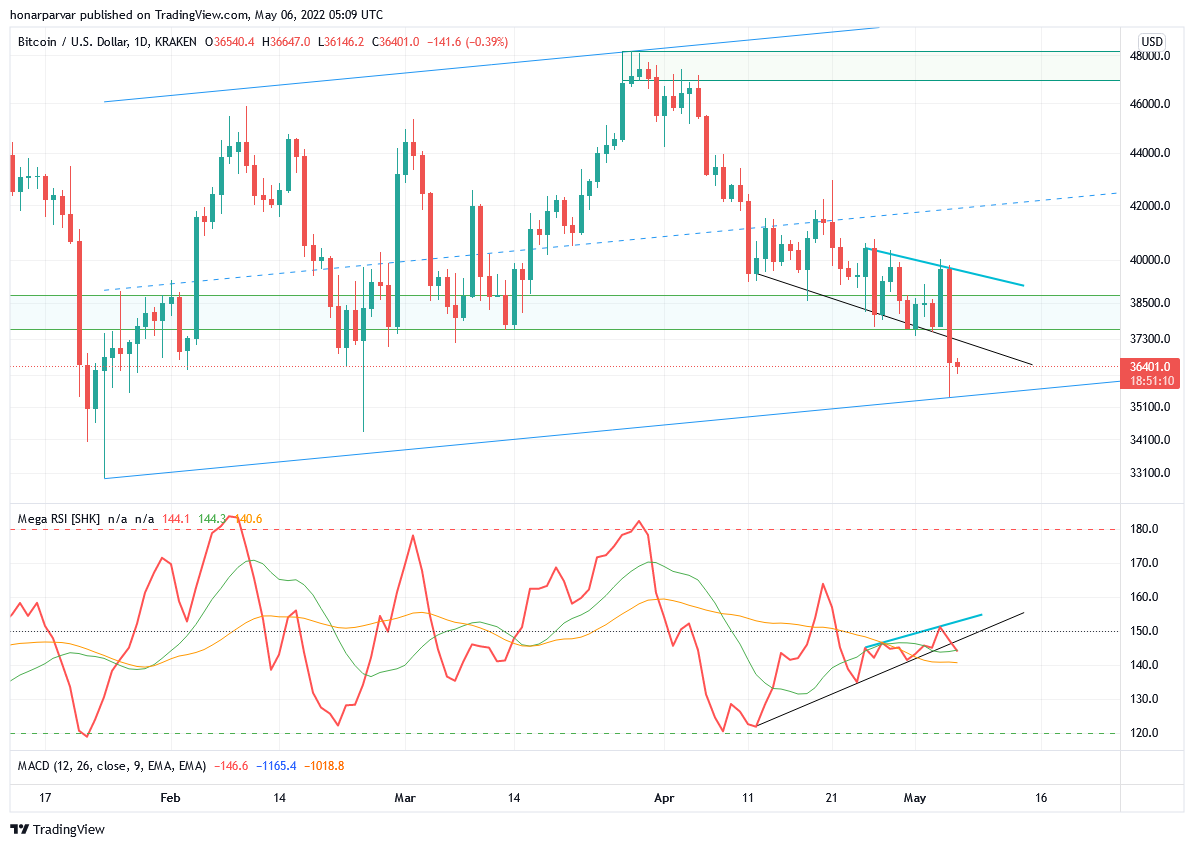
This is what I see now and my two scenarios:
the blue lines on indicator and price highs, shows a bearish hidden divergence;
the black lines on indicator and price lows, shows a bullish regular divergence;
I go short below the channel,
or I go long above the blue line.


