
This chart represent small holders of Bitcoin (0.1 to 1 BTC) in a timeframe going from 2011 up to today.
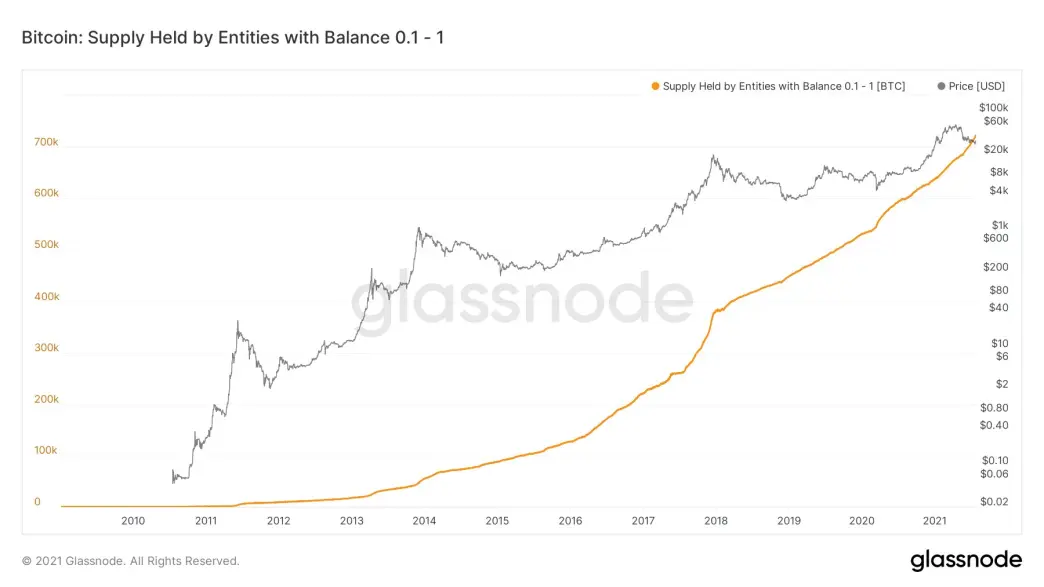
As it's clear to see, since this chart isn't price adjusted, despite the fact that in these last 10 years BTC has had 70x volume, a 100x move, and several 50% and more corrections, and that it has gone from $200 up to $60,000, demand hasn't changed a single bit. People are not scared of committing to BTC regardless of press or price; people have been buying and have never stopped. In other words, as the price of the product increases or decreases, demand for it remains constant. This behavior is called inelastic demand.
Similar examples can be found in everyday items like:
- Petrol – those with cars will need to buy petrol to get to work.
- Cigarettes – People who smoke become addicted so willing to pay a higher price.
- Salt – no close substitutes.
- Chocolate – no close substitutes.
An other facet that makes this chart even more impressive, is the fact that a buyer as soon he acquires 1 BTC falls off this chart. So for every buyer that reaches 1 BTC there are even more buyers reaching for the first time 0.1 BTC, effectively replacing the 1 BTC holder and more.
At current prices (~$38,500), each holding $3,500 to $35,000, combined they control ~$27,000,000,000 ($27 billion), around 4% of the total supply.
If we zoom in, and analyse the spanning a little bit more than one year, from january 2020 to today, we can see that the relationship has remained constant, not deviating in the bull market that hit the $60,000 all time high and in the following crash.
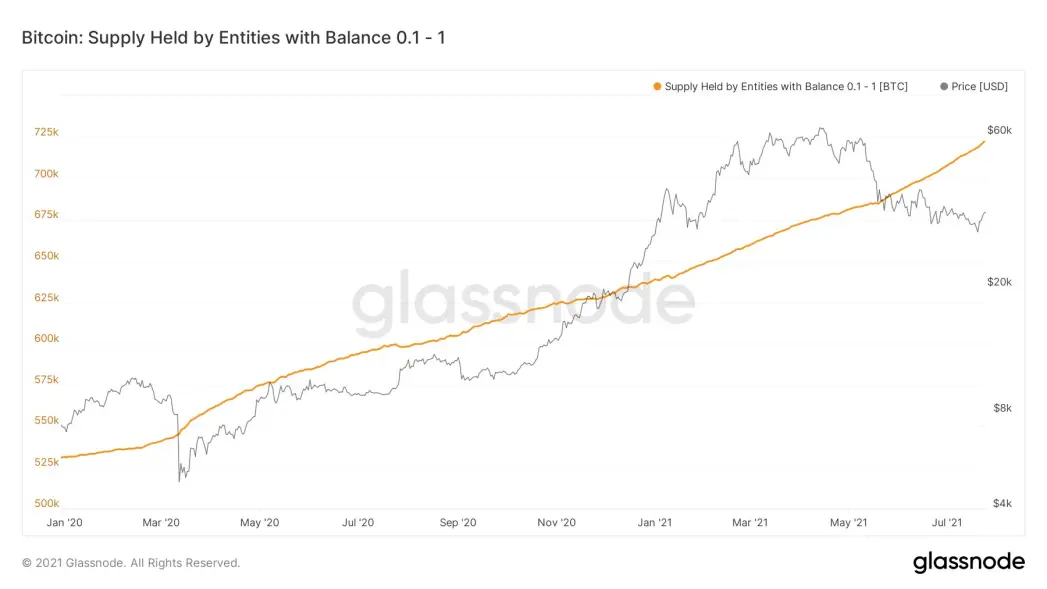
People have been accumulating this amount weekly, monthly following a fixed plan of DCA.
Long term these people will continue to accumulate and the patter will repeat itself. It's not a bullish outlook on future; it's more than that. It's an inevitable consequence. Whether you like it or not, it will keep growing






