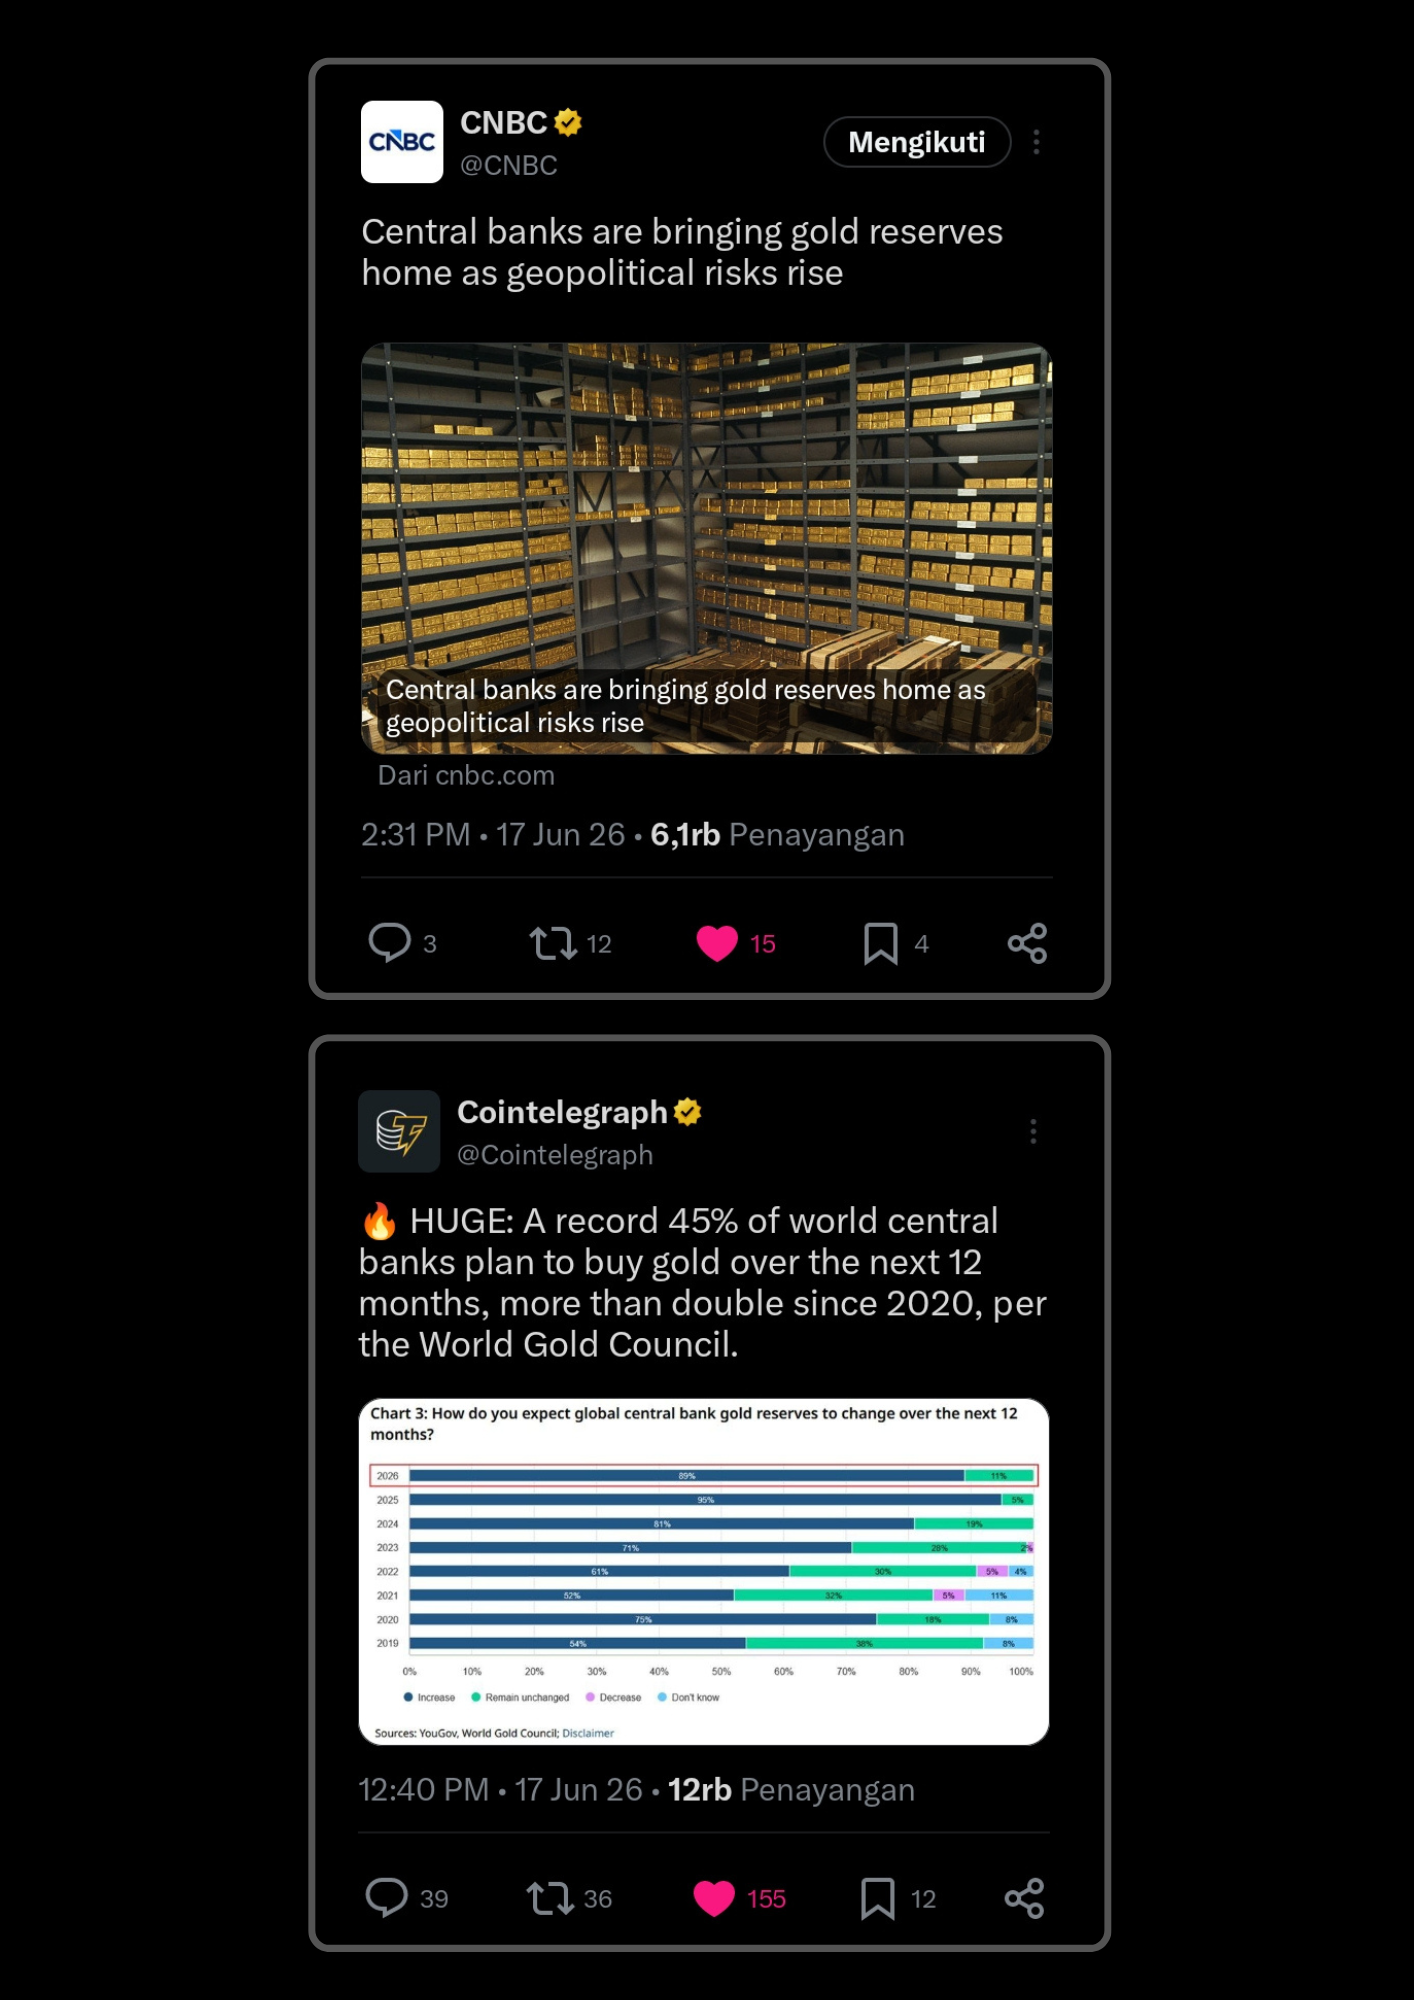
Lately, the global macro scene has been getting wild, and if you are tracking the big money flow, you can see that world central banks are making massive structural moves. According to recent reports on CNBC, these major institutions are aggressively pulling their physical gold reserves back home. The driving force behind this is simple. After seeing asset freezing sanctions hit Russia, central banks are getting nervous about keeping their wealth in foreign hands while global geopolitical tensions keep rising. Keeping liquid assets safe under their own roof has become the number one priority.
The numbers from the world gold council confirm just how big this trend is. Around 45% of central banks around the world are actively planning to increase their gold holdings over the next 12 months. That is more than double the percentage we saw back in 2020. It is a clear sign that institutional players are panicking behind the scenes, rushing to secure hard assets to dodge unpredictable global risks.
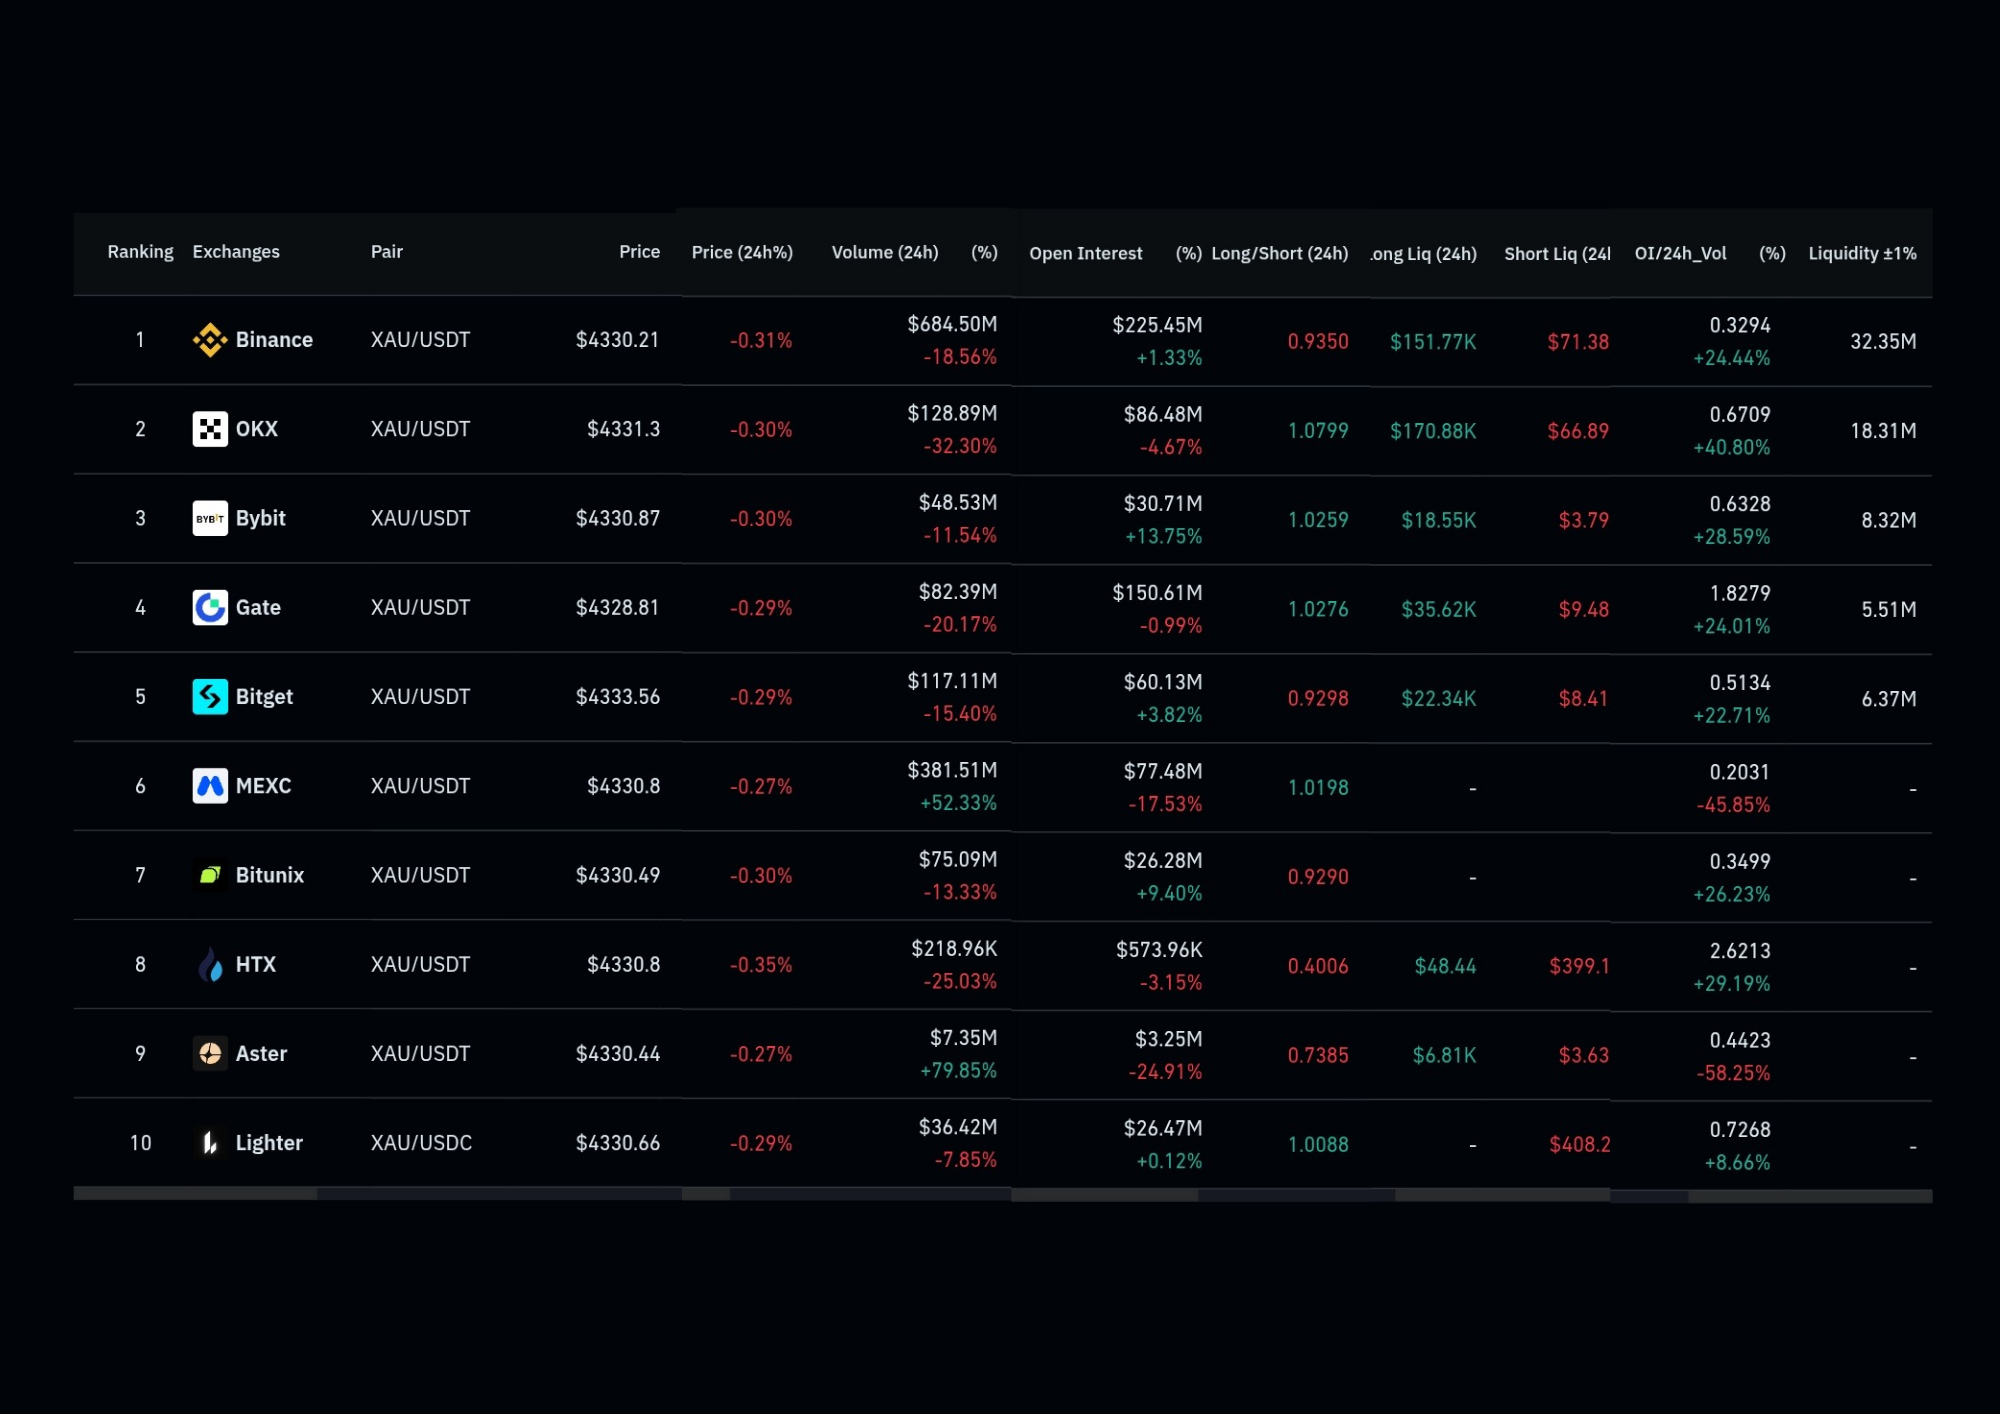
Looking closely at the derivative market data, the open interest for XAU/USD across major trading platforms like Binance, OKX, and Bybit remains heavily loaded. Daily trading volume is constantly hitting hundreds of millions of dollars, and the long short ratio is battling out a tight price range between $4.321 and $4.333 per ounce.
What is really interesting is the open interest weighted funding rate data. The chart shows high market volatility with several sudden green spikes, meaning long positions were paying a high premium right before the price experienced a sharp flush downward.
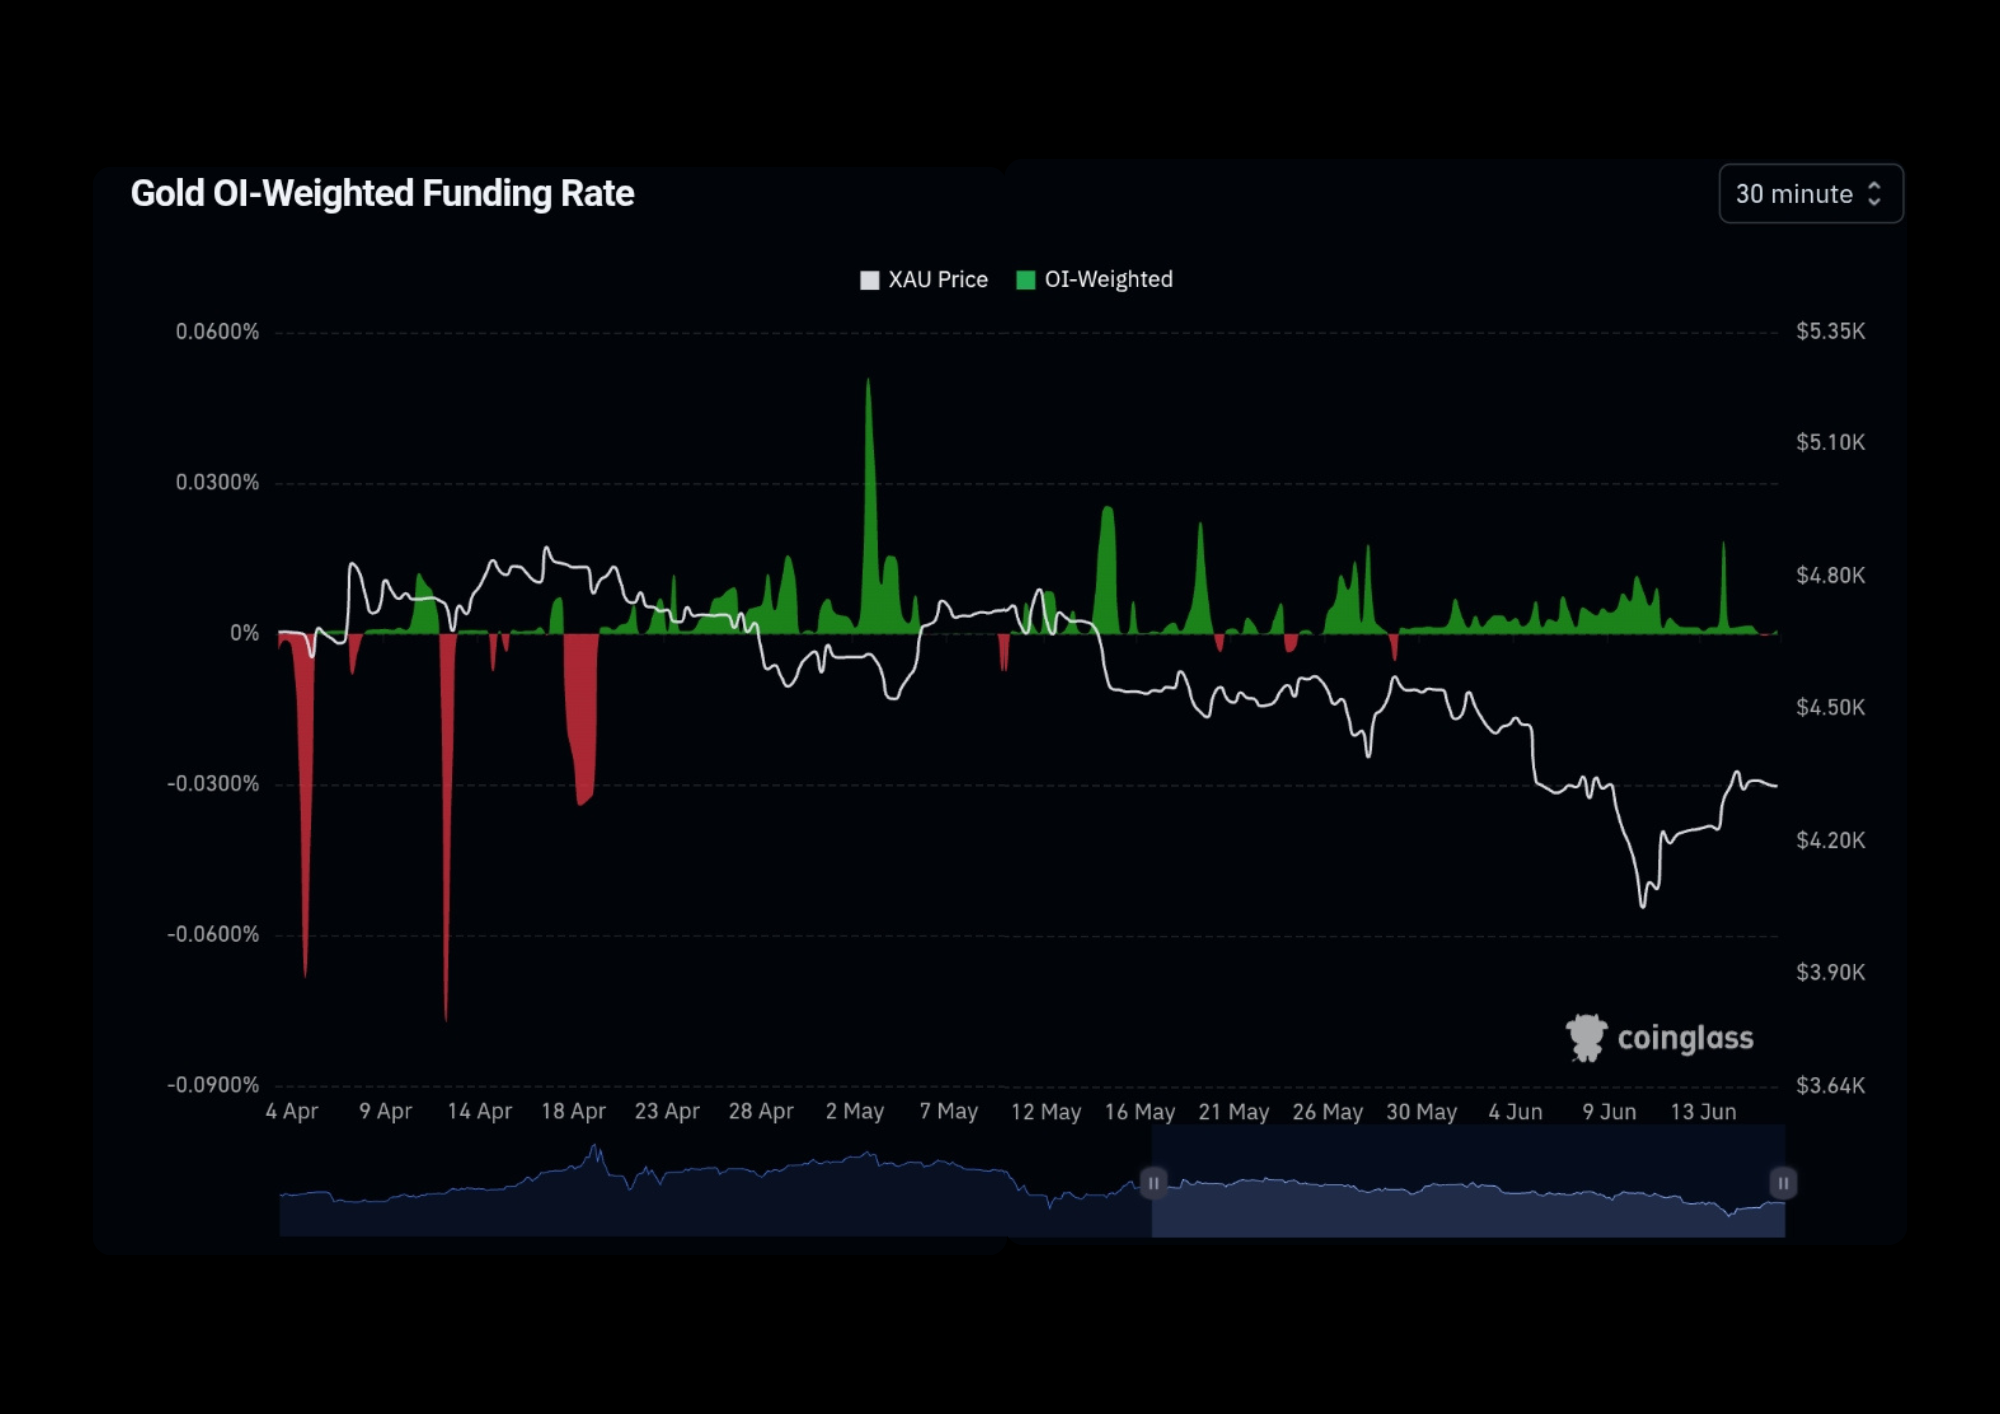
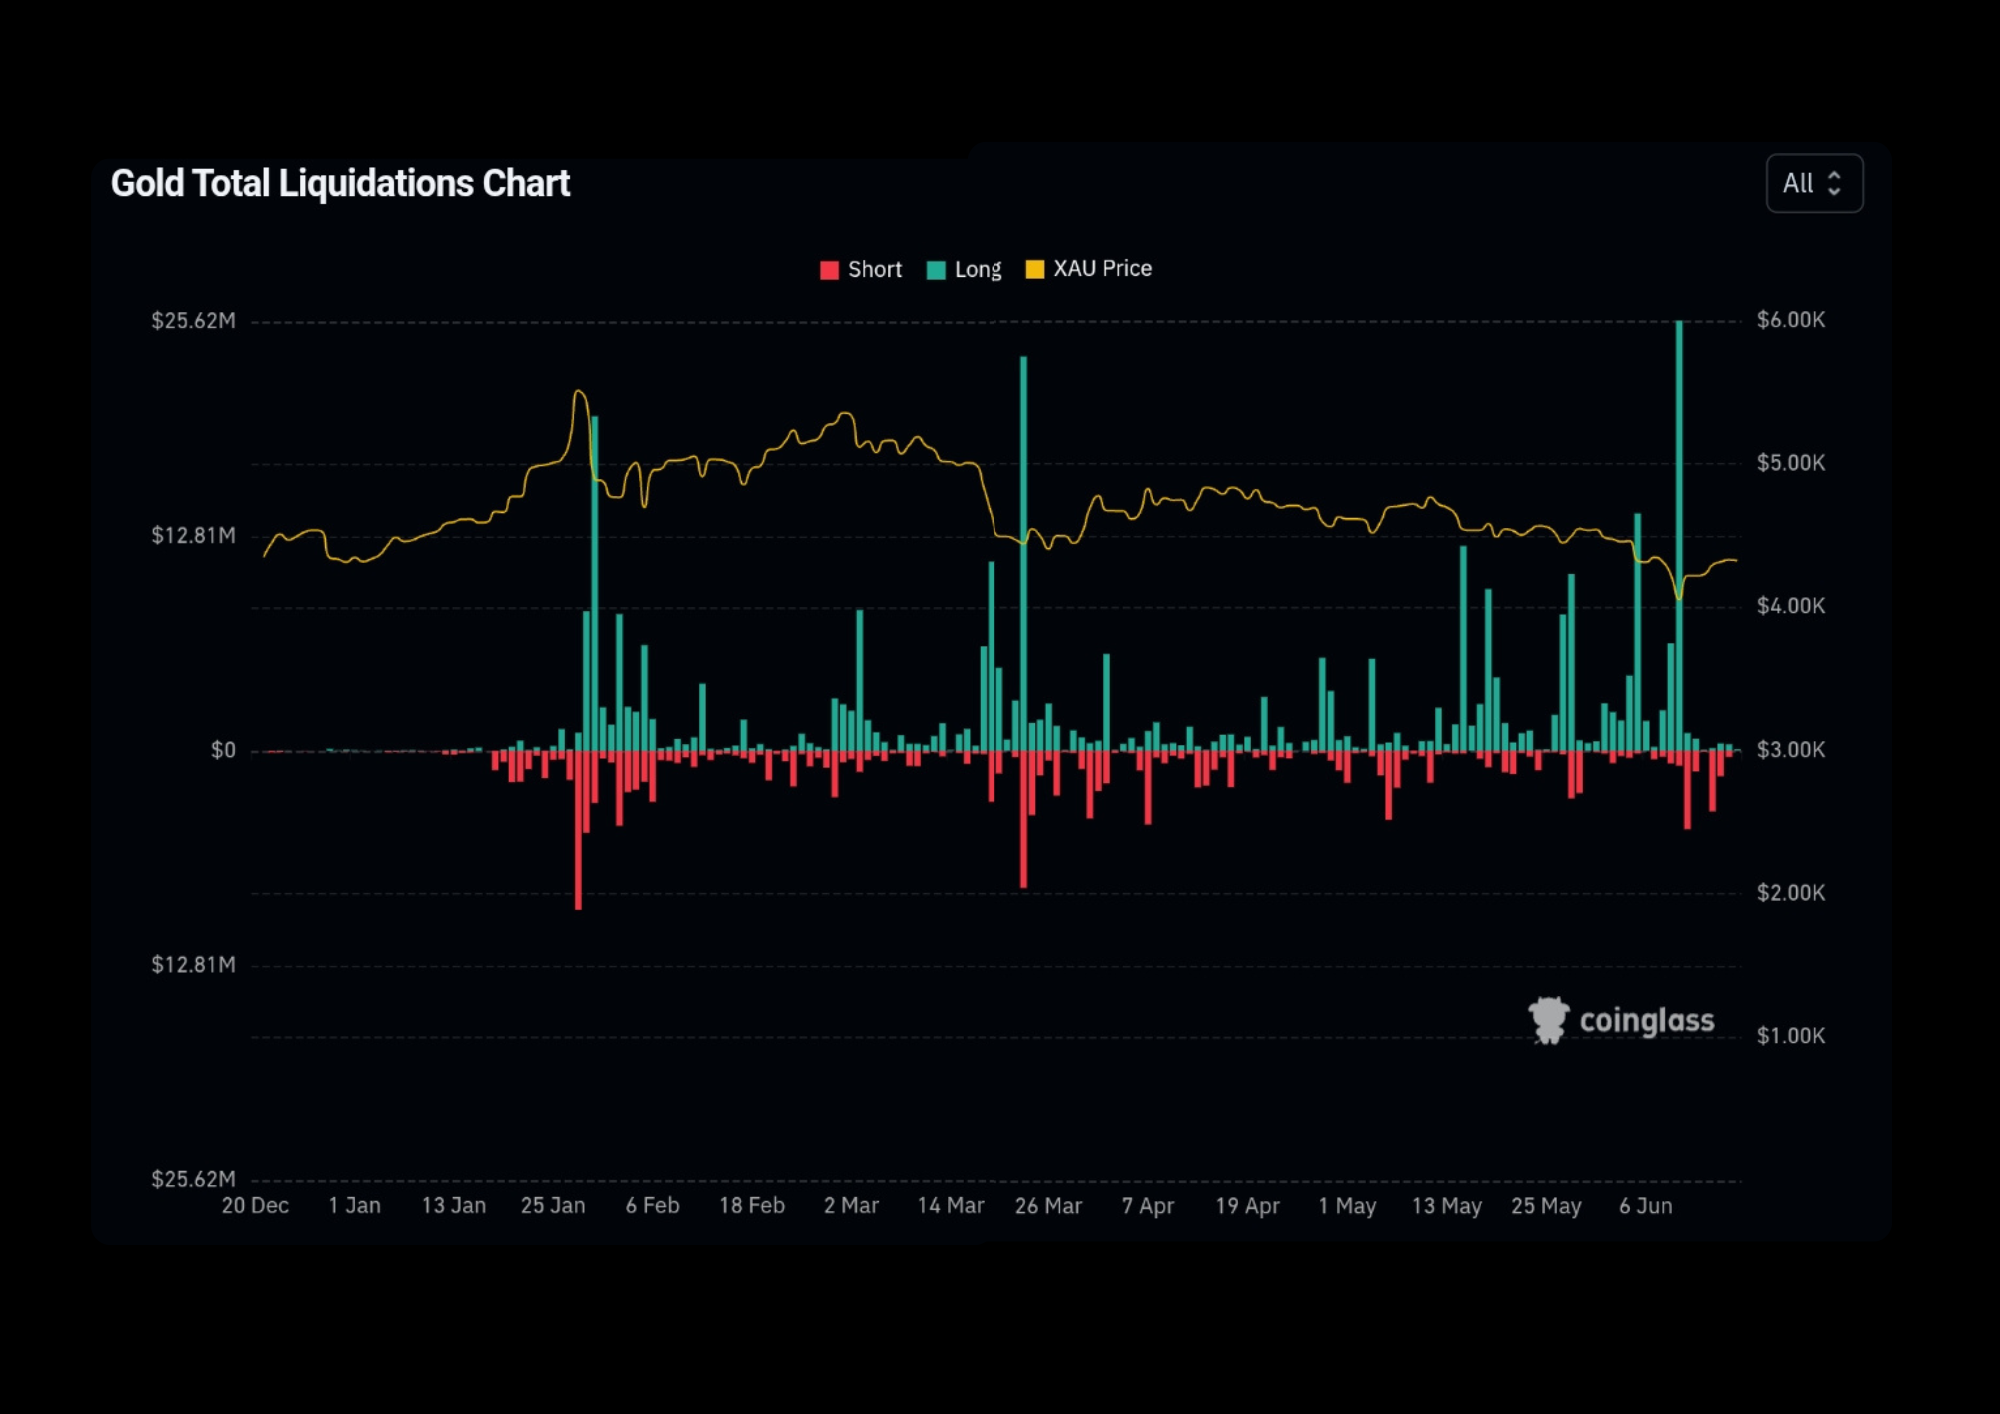
You can see the direct aftermath of that volatility on the gold total liquidations chart. Massive liquidation spikes hit over leveraged long traders, wiping them out completely as the price dipped into a temporary local bottom before starting its current slow recovery.
Let us map out the technical structure on TradingView to see where XAU/USD is likely going next. Looking at the daily or 1D chart, gold is currently fighting hard to hold its ground above a major structural area after that heavy shakeout.
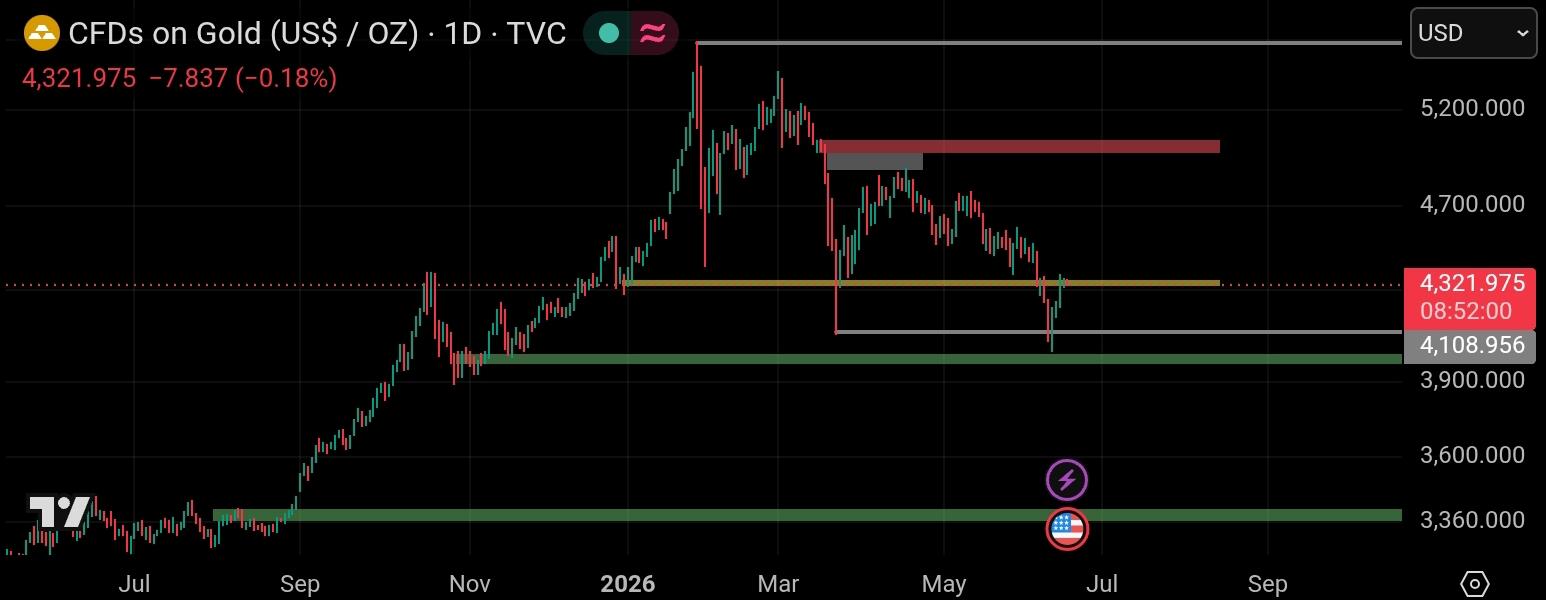
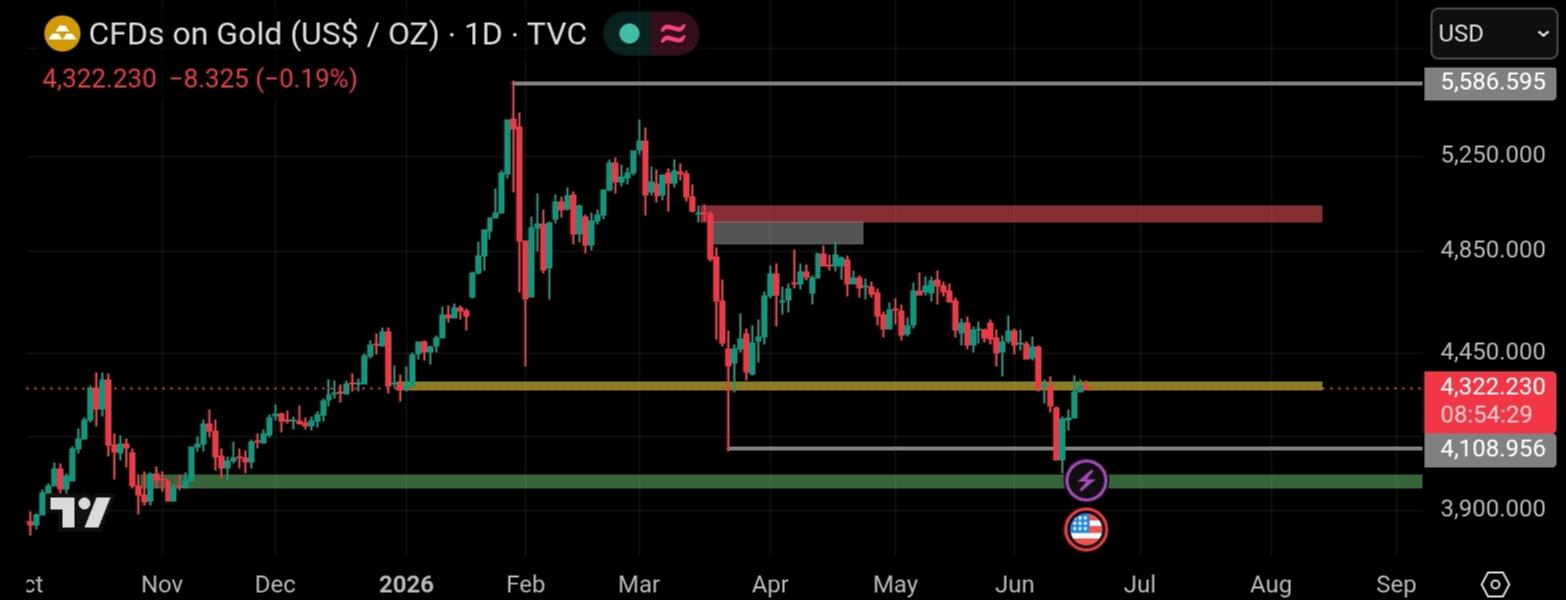
When you zoom out on the daily chart, the bigger picture shows that gold has managed a decent bounce after reacting strongly to the lower key support area.
Dropping down to the 1 hour or 1H chart gives us the exact details of the move. gold suffered a sharp drop straight into a major demand order block or demand OB area at the very bottom before buyers stepped in immediately, pushing the price back up into the consolidation zone.
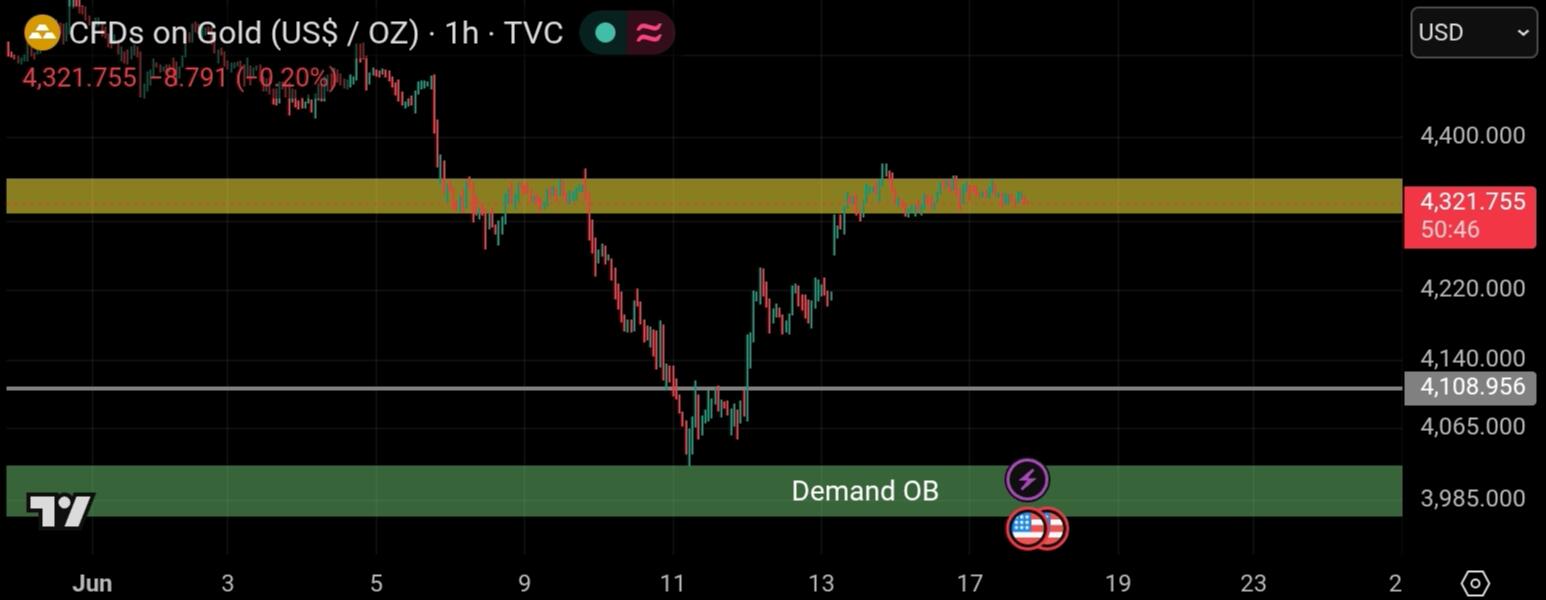
From a purely technical perspective, that yellow box on your screen is the main consolidation zone or sideways range that market participants are fighting over right now. If you are planning trades for the medium to long term, write down these key price levels. Your first major line of defense or support sits between $4.026.000 - $3.966.200. If the market takes a worst case turn and breaks that level, the second support area waiting to catch the drop is at $3.413.000 - $3.355.500. On the bullish side, if the market breaks out and starts a fresh uptrend, the next overhead resistance target is quite a long distance away, sitting up around the $5.050.000 - $4.960.720 zone.
My Opinion
When you connect the fundamental dots from the CNBC report with the technical price action on the charts, it looks like the recent drop into the demand OB was just a classic market clearing event. The market makers flushed out over leveraged retail long positions to build up liquidity before the next big expansion. The long term macro outlook for gold remains incredibly strong because continuous central bank buying provides a solid floor for the price. Because of this, any deep correction toward key support levels or demand OB areas should be viewed as a great discount to build long positions. Trying to short an asset with this much institutional backing and bullish macro momentum is just unnecessary risk.
Click here to read my authentic and original analysis
Source
⛔ Disclaimer: This article is strictly for informational and educational purposes only. It is not intended as financial advice, and I do not provide any trading signals. All investment decisions are your sole responsibility. Please ensure you conduct your own research (DYOR) before making any trades.