
The Notcoin price pumped over 2% in the last 24 hours to trade at $0.01595 at press time.
This recent increase has nudged the crypto’s weekly performance deeper into the green zone. As a result, the NOT price is up more than 33% over the past 7 days.
A Breakout Pattern Emerges on the Notcoin Price Chart
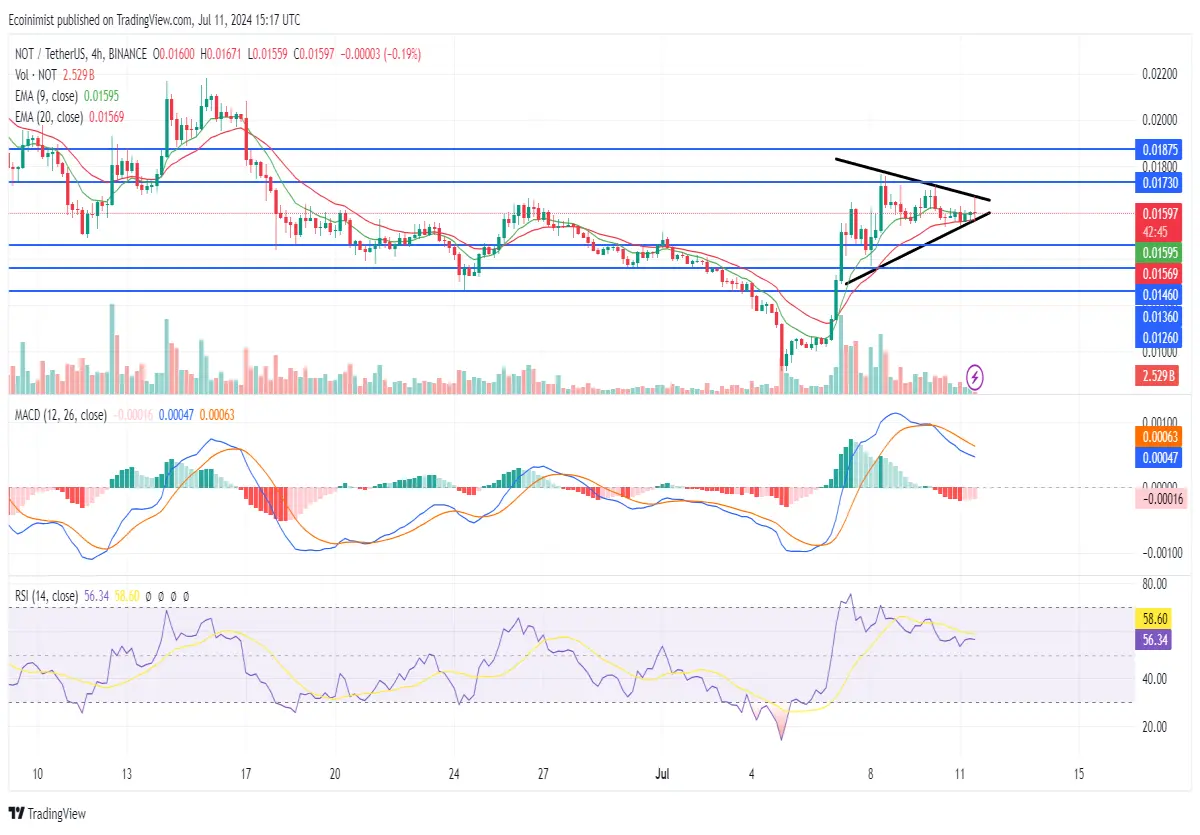
4-hour chart for NOT/USDT (Source: TradingView)
A symmetrical triangle has emerged on the 4-hour chart for the Notcoin price. This specific pattern suggests that NOT might undergo a strong move, but gives no clue as to which direction the move might be in.
Also read: What Is Tokenization: A Comprehensive Overview
If the Notcoin price surges, it could attempt to flip the resistance level at $0.01730 into support. Closing a 4-hour candle above this level might then give the crypto the foundation needed to rise to the next technical barrier at $0.01875.
On the other hand, a breakdown in the NOT price could see the altcoin drop to the immediate support level at $0.01460. Continued sell pressure should the crypto fall to this point might then lead to it plunging to $0.01360 in the following 24 hours. An extremely bearish scenario could see the Notcoin price plummet to as low as $0.01260.
Bearish Technical Signs Emerging
Technical indicators on NOT’s 4-hour chart suggest the crypto might fall in the next 24 hours. More specifically, the Moving Average Convergence Divergence (MACD), Relative Strength Index (RSI) and short-term Exponential Moving Averages (EMAs) are all showing bearish signs.
Also read: How to Invest in DeFi: A Guide to Decentralized Finance
The MACD line is currently positioned below the MACD Signal line. Traders usually see this orientation as an indication that a crypto is in a negative short-term phase. Meanwhile, the RSI is also positioned below its Simple Moving Average (SMA) line on the 4-hour chart to signal that sellers currently have the upper hand against buyers.
Momentum seems to be shifting in favor of sellers as well, with the 9 EMA collapsing in on the 20 EMA. An intersection between these two lines in the coming 24 hours will result in a major bearish flag being triggered. NOT could subsequently drop.
Disclaimer: The information presented in this article is for informational and educational purposes only. The article does not constitute financial advice or advice of any kind. Ecoinimist is not responsible for any losses incurred as a result of the utilization of content, products, or services mentioned. Readers are advised to exercise caution before taking any action related to the company.






