
Bitcoin is showing insane patterns which could possibly lead to $60,000 by the end of the week!
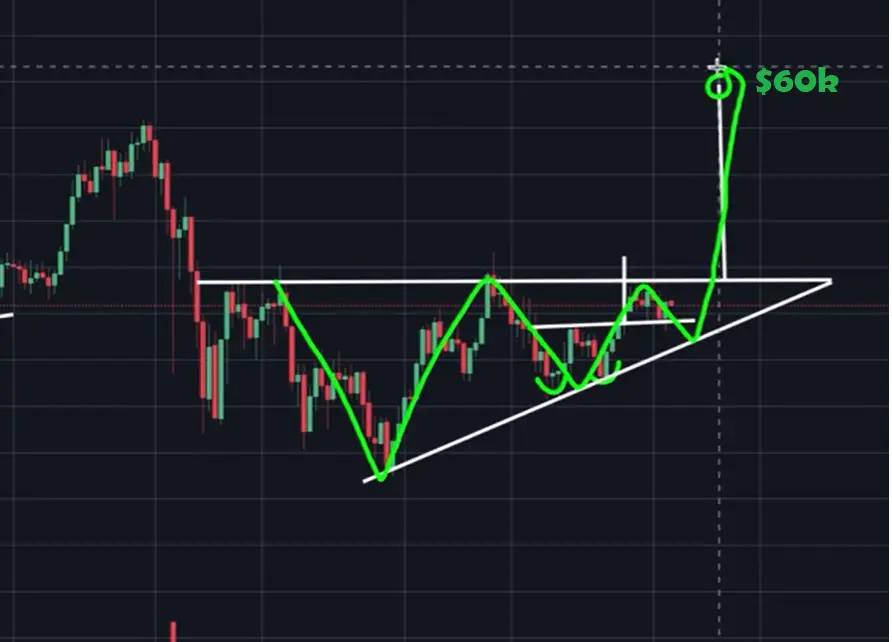
The breakout of the ascending Triangle is happening as we speak. The resistance and support are forming a bullish pattern which make it more likely for the break out to go up rather than down. A break out is expected before the 13th of March, and even though the direction is still to be determined, it is more probable that it will go up rather than down !
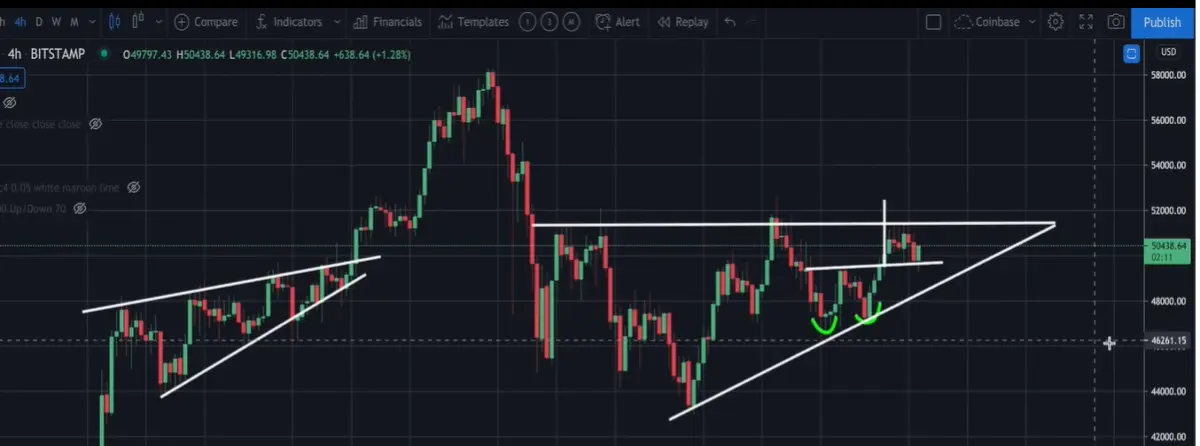
The Targets
- Bearish Scenario - ~$41,000
- Bullish Scenario - ~$ 60,000
Make sure you stay up to date with the Daily EMA to know whether it is more likely to bounce up or down. Historically, we can see that Bitcoin has done this before and most of the times resulted in a spike upwards! Considering that Bitcoin was so close to testing the $60k line around 2 weeks ago, this could probably result in another retest happening this week!

What are your thoughts?
Are you Bullish or Bearish?
Happy Trading!






