
In this article, we'll explore the difference between Trading and Investing, how to build a portfolio, and capital rotation. I'll present some indicators that will allow you to speculate on one asset over another or to know when to rotate a small percentage of your capital into riskier assets.
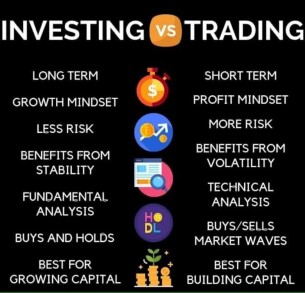
TRADING
Trading doesn't look at fundamentals: it's purely speculative "positions" with "take profit" (if I'm making a profit) or "stop loss" (if I'm losing). You can trade any asset, as long as it has a good chart. Charts are usually viewed in dollars (BTC/USDT) or in BTC (for example, ETH/BTC or SOL/BTC) because if I'm trading altcoins (everything other than BTC), I'm interested in finding assets that perform better than BTC (looking at the chart in dollars makes less sense). The goal is to manage risk, capital, and discipline before opening a trade.
🔹 Risk & Capital.
-Maximum capital you're willing to lose.
-Stop Loss per trade (% of risk).
-Maximum number of consecutive stop losses tolerable (to avoid negative variance. The Equity Curve Simulator calculation can be helpful).
-Maximum daily and monthly risk (to avoid excessive losses).
🔹 Discipline & Preparation.
-Pre-market analysis.
-Psychological condition (no stress trading, FOMO, revenge after losses).
-Updated trading journal (notes of trades, capital, losses, gains, etc., used to analyze successful trades and mistakes).
🔹 Performance Metrics.
-Average R:R (Risk/Reward) per setup (risk/reward per trade).
-Maximum acceptable drawdown.
-Expectancy = (Win Rate × Average Profit) – (Loss Rate × Average Loss).
🔹 Position Management.
-Size of each trade.
-Correlation between assets (to avoid excessive aggregate risk if you trade or are exposed to correlated assets).
-Liquidity and slippage (especially for low-liquidity altcoins).
🔹 Market Condition.
- Trend (bullish/bearish).
- Volatility ranges or compression phases.
- Implied/realized volatility.
INVESTMENT
Investment, on the other hand, refers to that portion of your portfolio that you won't touch for years (5-10 years), regardless of price (except for rebalancing, if desired). You could use a DCA (buy fixed amounts every month) and accumulate the assets you decide to invest in (ideally, those that perform better than the euro/dollar/yen/fiat). To choose an asset, you look at the fundamentals: circulating supply compared to the total (i.e., inflation), unlocks, utility (what is the token used for?) and holders. Utility is very important: does this crypto/token have demand? Is it used as gas? Do some of the profits generated by a platform go to the holders of the native token? Does it have buybacks and burns? Does it offer any holding advantages? Discounts (e.g., exchange tokens)? Does it allow me to farm other tokens?
The crypto asset that has consistently performed well from one cycle to the next is BTC. Partly ETH, BNB and SOL.
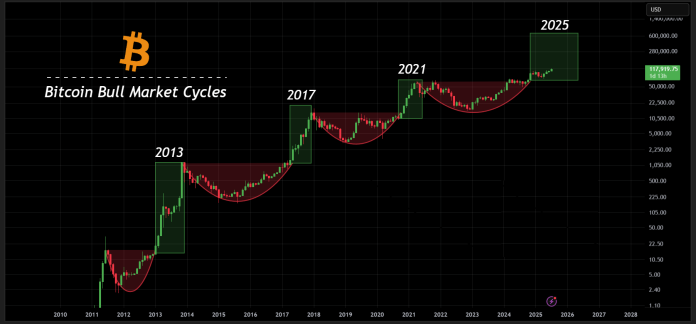
LONG-TERM PORTFOLIO AND CYCLES
I can manage my portfolio by distinguishing between long-term (BTC and perhaps ETH), large-cap (SOL and BNB) and mid-cap (going down in market cap). I can diversify my investment with mid-/low-caps by allocating a small percentage of the total across one or more sectors of my choosing (Layer 1, Layer 2, Defi tokens, Perps Exchange, DePIN, RWA, Gaming, NFT, memecoins, etc.), but the time horizon shouldn't be too long because crypto "trends" change from cycle to cycle (when "investing" in altcoins, there's always a gambling component, a mix of medium-term holdings and speculation). BTC cycles are dictated by the halving (halving of inflation and therefore of the rewards received by miners every four years): 2012, 2016, 2020, 2024, 2028, and so on until 2140 (when the last Satoshi, the smallest fraction of BTC, will be issued). The crypto market has been incredibly cyclical since its inception, although institutional (ETF) and political narratives may have made the cycle more irregular. So far, we have seen:
2012=Halving.
2013=Bull Market (BTC ATH in November 2013).
2014=Bear Market.
2015=Laterality.
2016=Halving.
2017=Bull Market (BTC ATH in December 2017).
2018=Bear Market.
2019=Laterality.
2020=Halving.
2021=Bull Market (BTC ATH in November 2021).
2022=Bear Market.
2023=Laterality.
2024=Halving.
2025=Bull Market (BTC ATH in August 2025, for now).
Generally, to build my portfolio, I need to consider:
-Risk appetite.
-Time horizon (how long will my money remain invested).
-Knowledge of the market (the crypto market is different from the stock market, partly in terms of cycles and certainly in terms of volatility).
The only asset I can hold over time (5-10 years) has proven to be BTC. If you accept more risk and volatility, you can add ETH. If you believe Binance will remain the leading exchange and won't go bankrupt, you can invest in BNB. Finally, SOL, because its low fees could become the retail chain. What's important to monitor are the "macrotrends" over the years. You can see that, although BTC is subject to bubbles, it has consistently reached new highs throughout its history (2013, 2017, 2021, 2025). This isn't a rule that will continue indefinitely, but for now, that's how it is.
Any purchase of altcoins must remain speculative and with a trading timeframe of 1-2 months or holding timeframe of about 1 year. An altcoin can gain as much as 300% in a week, but these rapid, impulsive movements don't indicate actual use, but rather simple speculation driven by FOMO, news, integrations or partnerships. A fundamental rule is that anything that expands in the short term then retraces.
For example, I can think of a portfolio like this:
BTC (55%).
ETH (25%).
SOL/BNB (15%).
Degen/low cap (5%).
Any portfolio rebalancing (once a month or every two months) allows you to sell assets that have performed well in favor of others that have performed poorly (for example, if ETH rises to 30% and BTC falls to 50%, I bring ETH back to 25% and BTC to 55%). The important thing is that the percentages remain broadly constant. Traditional "buy & hodl" does not involve rebalancing (but in this case, it's better to be exposed only to BTC, at most BTC+ETH).
🔹 Macro Indicators.
- Total Market Cap (how the sector is growing compared to previous years).
- Total 3 (excluding BTC, ETH, stablecoins).
- Stablecoin Market Cap (buy inflows and sell outflows).
- Stablecoin Supply Ratio: SSR (ratio between BTC market cap and stablecoin; indicates how much capital is available to buy cryptocurrencies).
🔹 Dominance & Relative Indicators.
- Bitcoin Dominance (in the past, we've seen variations from 70% to 30%, but due to ETF and institutional investors, we're unlikely to see such a low BTC dominance again. Indicates liquidity rotation from BTC to altcoins when it drops and vice versa when it rises).
- ETH/BTC ratio (if ETH outperforms BTC → early alt season signal, average duration ~3 months).
- Altcoin Season Index (the chart indicates the strength of altcoins relative to BTC).
🔹 Derivatives & Leverage Indicators (to see FOMO and possible liquidations).
- Aggregate Open Interest (indicates risk expansion or contraction).
- Funding Rates (very positive: excess long leverage; very negative: excess short leverage).
🔹 Flows & Liquidity.
- Net inflow/outflow on exchanges (BTC/ETH).
- Stablecoin movements to exchanges (capital ready to enter the market).
- Liquidity pools (for altcoins and DeFi).
🔹 On-chain (provides signals on the strength of the cycle).
- NUPL (Net Unrealized Profit/Loss).
- MVRV Z-Score (to identify periods where Bitcoin or Crypto are extremely over or undervalued relative to its "fair value").
- SOPR (Spent Output Profit Ratio).
Are you interested in ways to earn crypto bonus? Check it out here: Some Sites To Earn Crypto Bonus (Old & New)


