
In this article we will see the main indicators/tools used in Volumetric Analysis (Trading). In addition, some examples will be given to fully understand how they work and their usefulness. Please note that some of these indicators are very complex so you need to understand them before using them.
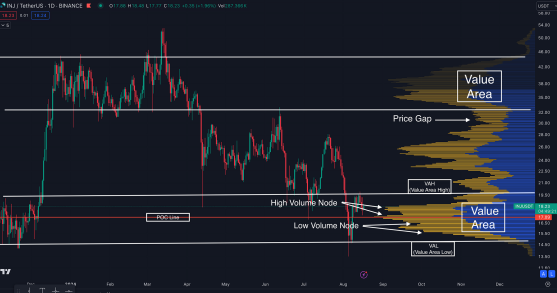
VOLUME PROFILE
This is a vertical histogram that shows the volume traded at each price level in a given time interval.
It highlights the price areas where the greatest number of trades have been concentrated (high activity).
Parameters to consider: POC (Point of Control) i.e. the price with the highest volume, VAH/VAL (Value Area High/Low) i.e. the area that contains approximately 70% of the volume.
It is used to identify dynamic supports/resistances, areas of institutional interest, possible reversals or breakouts.
Example: BTC's Volume Profile shows a strong trading area around $100,000. This level, being the POC (highest volume), acts as a magnet for the price: if BTC breaks upwards and bounces, it can be support; if it is broken downwards with an increase in volume, it can signal a distribution phase with a decline towards areas of lower volume.
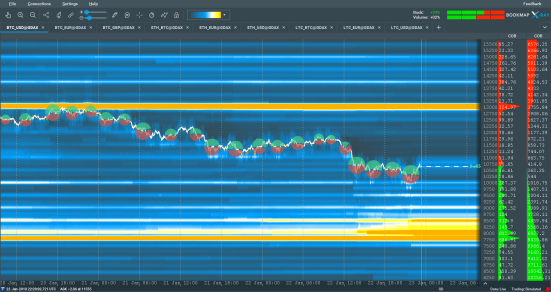
HEATMAP
It represents the graphical visualization of the market depth (order book) in real time. The order book of an exchange is where buy/sell orders are entered. It shows where limit orders to buy and sell are placed with more intense colors for higher volumes.
To consider: Order size, distance from the current price, persistence of orders. They are used to identify potential support/resistance areas, liquidity fronts, possible market manipulation (spoofing).
Example: on a heatmap (TensorCharts), you notice large blocks of limit orders to sell at $105,000 that persist over time. This suggests a visible resistance to the market. If the price approaches that level but fails to break it, traders can expect a bearish reaction or an attempt at absorption.
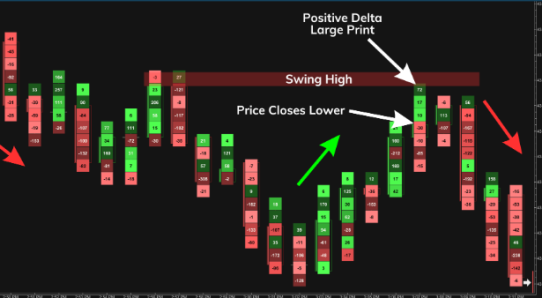
FOOTPRINT CHART
It represents a candlestick chart that shows the volume traded at each price within a single candle.
It indicates the buying (ask) and selling (bid) activity per price level.
Key parameters: Delta (difference bid/ask), cumulative delta, volume per level. It is used to evaluate the imbalance between buyers and sellers, confirm breakouts, identify absorptions or exhaustion.
Example: a footprint candle on BTC at 5 minutes shows that at $101,2k, 3,500 BTC were traded in aggressive buying and only 700 BTC in selling, with a net positive delta (2800 BTC). This indicates strong buying pressure and can suggest a continuation of the trend if followed by other candles with positive delta.
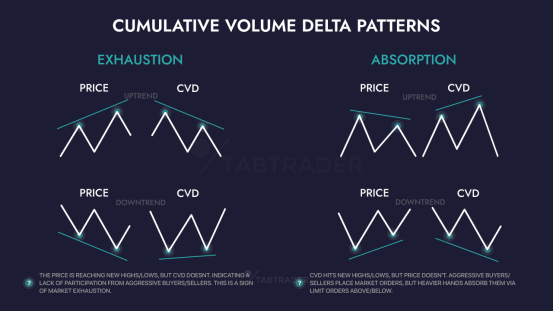
CUMULATIVE VOLUME DELTA
Indicator that adds the difference between "aggressive" buying and selling volumes over time. Indicates the real direction and strength of the market behind the price movement.
Key parameters: Positive or negative Delta, divergences with the price.
Detects divergences (e.g. price rises but delta falls), useful for confirming trends or identifying possible reversals.
Example: suppose that BTC rises from $98,000 to $100,000, the CVD begins to fall, indicating that the rise is supported more by passive orders (limit) than by aggressive orders (market). This divergence could signal weakness in the trend and a possible imminent correction.
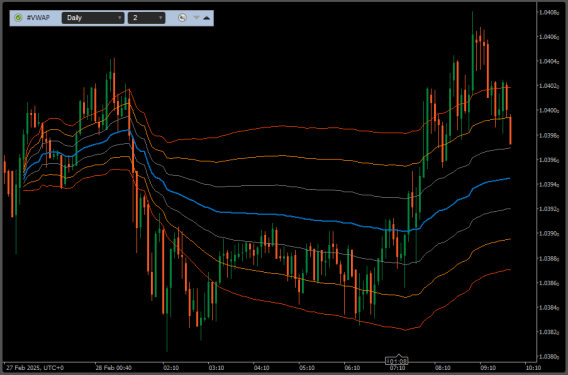
VWAP (VOLUME WEIGHTED AVERAGE PRICE)
This is the volume-weighted average price and represents the average price at which an asset has been traded over time, taking into account the volume. Key parameters: standard deviations (VWAP bands).
It is used to identify dynamic supports/resistances and as a strategy to return to fair prices.
Example: In the daily session, BTC drops below the intraday VWAP (e.g. $90,500), but in the afternoon it retraces above with increasing volume. This could be interpreted as a re-entry above the average price and is often used as a long setup by intraday or algorithmic traders.
Are you interested in ways to earn crypto bonus? Check it out here: Some Sites To Earn Crypto Bonus (Old & New)


