
In this week's weekly market update, we are going to look at what has happened in the fixed income, money market, commodities and U.S. equity last week, and discuss what these would carry for the crypto market.
Fixed Income and Money Market
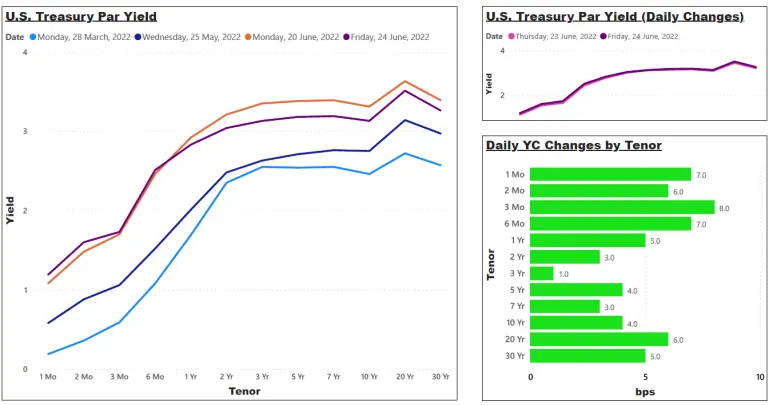
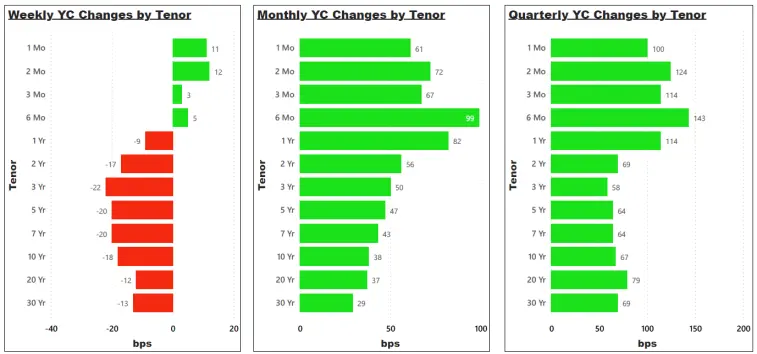
U.S. treasury par yield curve has flattened over the week with its short-end rates (1-Month to 6-Month tenors) rising and its long-end rates falling. The entire yield curve has shifted upwards across all tenors by 29 to 99 basis points, bp (i.e. 0.29% to 0.99%) from last month’s position as Federal Reserve just confirmed its stance on raising the rate by 75 bp, the most significant rate hike since 1994 with the hope of bringing down unsavory inflation numbers.

10-year – 2-year bond spread is a key measure of the steepness of the yield curve, calculated as 10-year par rate minus 2-year par rate. After April’s recovery, it is obvious that the curve has now flattening again with just 9 bp above the yield curve inversion point (a point which is often viewed as an indicator of upcoming economic recession).

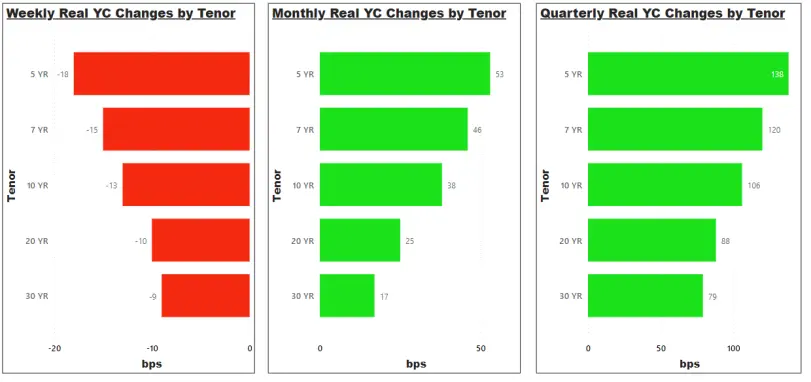
5-year U.S. treasury real par yield, on the other hand, has turned positive this month. U.S. treasury real par yield is derived based on the market bid price of Treasury Inflation-Protected Securities (TIPS), which is often priced with the formula of nominal yield minus expected inflation. A negative real par yield is often caused by either lower nominal yield or higher expected inflation. In this case, it’s most likely the latter as the 5-year nominal yield was 47 bp higher than the previous month. This happened as the market is pricing in lower expected inflation within the next 5 years.
The whole yield curve movement as we see here is that market has already begun to price in a near-term recessionary economy within a high borrowing rate environment. This spells badly for the overall economy as well as other risky assets like equities and cryptos.
Commodities

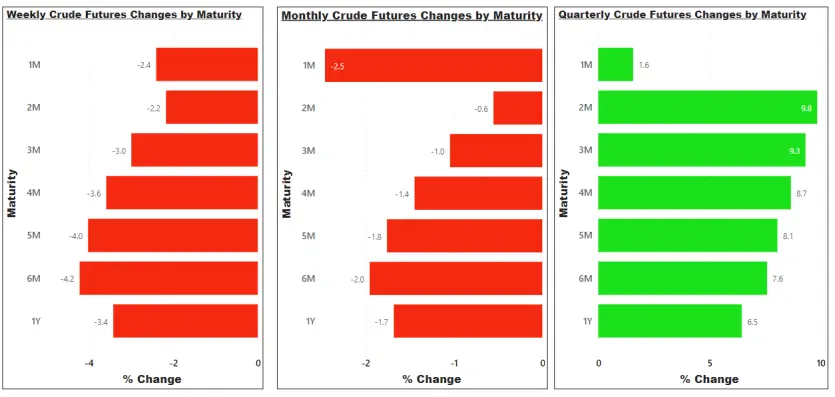

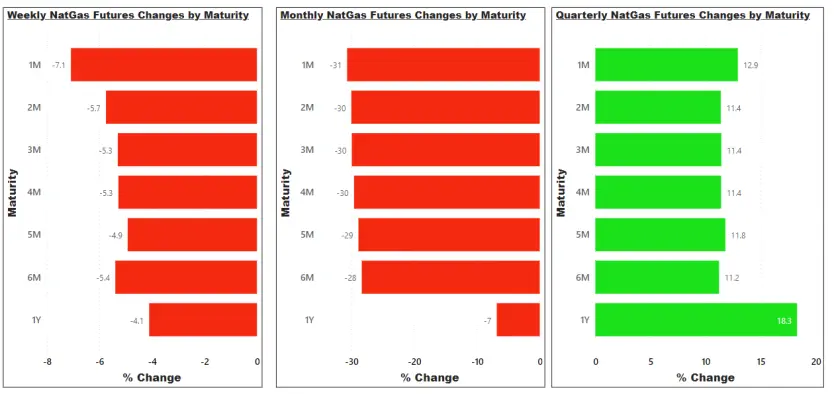
Now, let us have a look at the commodities futures market.
A pending recession and lower demand has been priced into the futures market last week, with crude oil futures falling by 2.4% to 3.4% and natural gas futures falling by 4.1% to 7.1% across all maturities. The crack in the energy market last week was eventually being priced into the equities market as well, with the oil and gas exploration sector dropping by 5.2% while other sectors are rising.

Equities

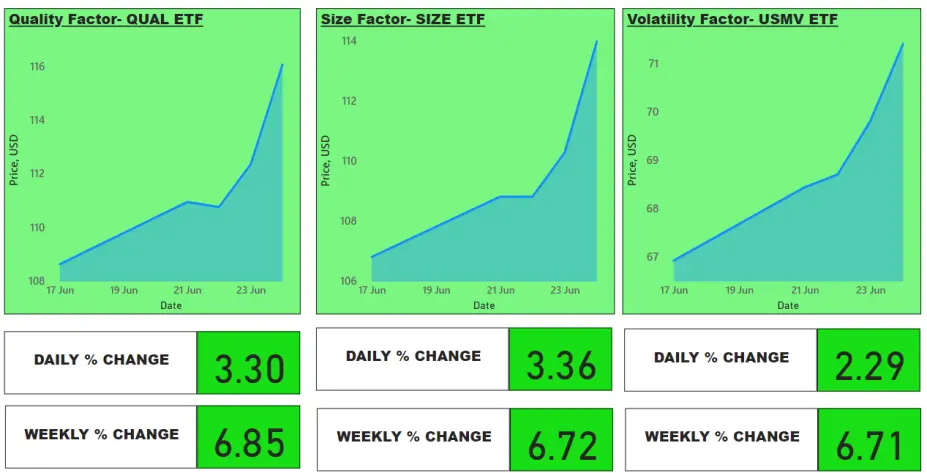
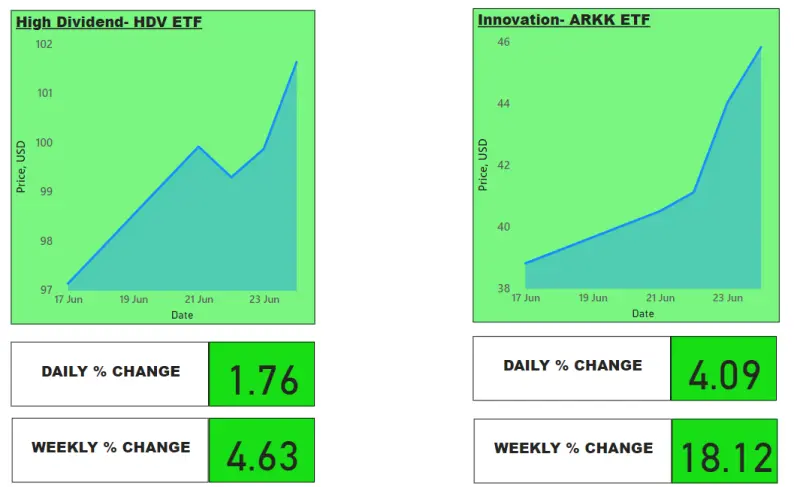
While fixed income, money market and commodities markets are falling, the equity market was rising last week, with the innovation factor (represented by ARK Invest flagship innovation ETF, ARKK) taking the lead, making a whopping gain of 18.12% just by last week alone!
There is not any specific positive news that drives the bullish equity trend last week. It may be due to the removal of uncertainty premium around 75bp rate hike after the Fed’s confirmation which the market may have already priced in previously. It may also happen as some long-term value investors are buying up value stocks with viable business models that have been overcorrected during the past equity market bloodbath. Does this signify that the equity market has bottomed out? It’s still very early to say and I am taking a cautious stance to see what would happen this week.
Cryptos

It was a rather good week for Bitcoin last week as Bitcoin made a comeback of 3.71% weekly return last week. Its correlation with S&P 500 stocks still remains high at 0.85, hence not being viewed by many as a risk-off asset at this moment. While its 30-day 95% Value-at-Risk has been coming down 5% last week, its downside risk has undoubtedly increased as its daily return has now become more negatively skewed with a much fatter tail (indicated by a higher kurtosis value). Overall, based on historical statistics, Bitcoin has now become more susceptible to a large drawdown from the quantitative finance perspective.
Connect with me at:
Reference:
1. Thumbnail image here was downloaded from Unsplash, where credit is given to Marga Santoso, the publisher of this photo.
2. Warren Buffett Adds To Massive Stake In Occidental Petroleum, Buying The Dip After Oil Prices Drop






