
Investment Disclaimer:
- I am not a registered investment, legal, or tax adviser or a broker/dealer, and all opinions expressed by me are from my research for educational purposes only.
- Past performance presented here is not an indicator of future performance.
- This post expresses my own opinion about the cryptocurrency mentioned herein and is not an offer to buy or sell, or a solicitation of any offer to buy or sell the cryptocurrency mentioned in this post.
- I do hold a long position in SRM as a token holder.
PSA
Ukraine Donation Drive
If you would like to provide humanitarian support in crypto form to Ukrainian war victims and refugees, please donate it via the following addresses. BTC, ETH and USDT (TRC20) are supported.
(Taken from the official Tweet of Ukrainian Vice Prime Minister)
This research writing is sponsored by Multi-Chain DeFi Liquidation Tracker, a decentralized finance (DeFi) data aggregator which tracks and analyses liquidation events across DeFi protocols of various blockchains in real time. While the app is still under development, you may follow their Twitter page for daily updates of liquidation statistics and charts.
TL; DR
If you have no time to read through all the details, here are the main takeaways from today's writing.
-> Project Serum launches Serum accelerator for inspiring developers who are eager to build on Serum.
-> [Technical Analysis] Bollinger Band and VWAP are implying that SRM was oversold, while MACD is suggesting that SRM has recovered from its low and now trending upwards.
-> [Quantitative Risk Analysis] Value-at-Risk is suggesting that SRM is trading at a less riskier level as compared to 10 days ago.
-> The long-short ratio of SRMUSDT futures was steadily declining on Binance exchange in the month of February, with more long futures traders exiting their positions.
-> At the time of writing, the crypto futures market is in a "risk-off" mode now with sell volumes building up on more volatile SRMUSDT futures while the buy volumes were building up on the less volatile BTCUSDT and ETHUSDT futures for the past few hours.
0. Introduction to Project Serum
Serum provides a fully on-chain orderbook on Solana blockchain, allowing applications such as trading interfaces to 'plug into' Serum's composable ecosystem. An order made on one dApp composing with a Serum orderbook market can be matched with a completely separate order made with that same market.
1A. Serum Project Updates
1. Introducing Serum Accelerator (23 Feb 2022)
Serum Accelerator is designed to support the growth of startups who plan on actively contributing to Serum. The first cohort of 10-week long Accelerator features 12 different startups building protocols on various areas ranging from DeFi, financialization of NFT, GameFi, as well as hybrid DeFi and TradFi products.
2. How Serum Performs Relative to Other Cryptos ?
Performance of All DEX Cryptos Under Quantdoge's Watchlist since 2021 (Sorted by % Return)
Sorted By Price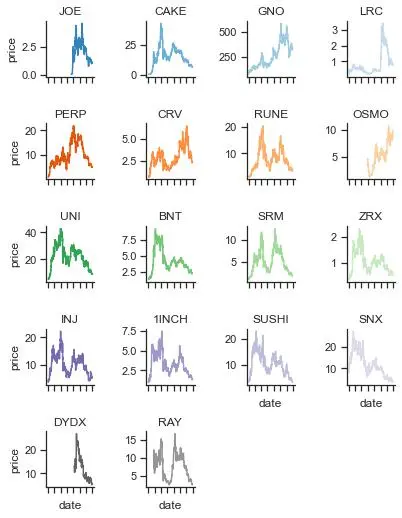
SRM has undergone 75.53% return from USD 1.1305 to USD 1.9844 since 01 Jan 2021.
SRM is the 11th best performing crypto assets among others here.
Sorted by Market Cap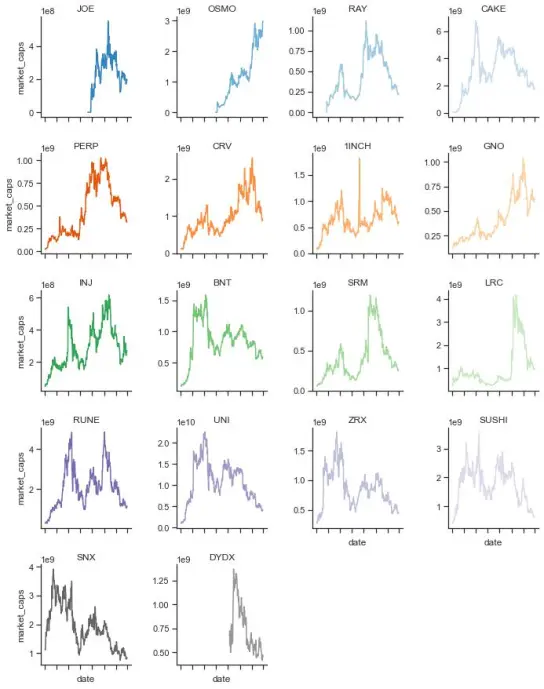
Serum's market cap has increased 366.64% from USD 56.56M to USD 263.91M since 01 Jan 2021.
Serum is the 11th largest crypto asset by market cap among other DEX cryptos here.
3. Technical Analysis on Serum
3.1. Volume Weighted Average Price (VWAP)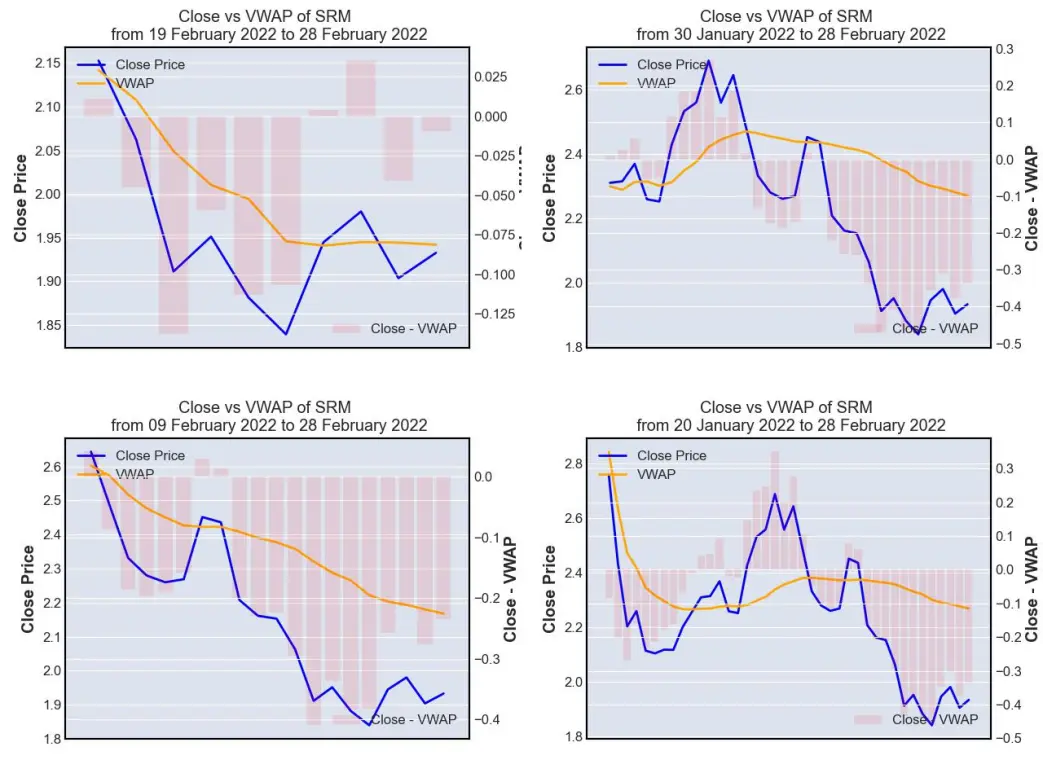
VWAP is a technical indicator used by a trader to gauge the overall trend of an asset price movement. VWAP line (orange line) represents the volume-weighted average price (average price here is defined as the average of high, low and close prices) while close price line (blue line) represents the price when SRM is closed at the end of every single day.
Whenever blue line (close price) is above orange line (VWAP), it indicates that the asset is gaining momentum and being traded higher than its average price level. This would represent a 'buy' opportunity for short-term momentum trader whom task is to trade following the trend while a longer term mean-revision trader might take it as a 'sell' opportunity, anticipating that the price of SRM (blue line) to fall to its average level (orange line).
Whenever blue line (close price) is below orange line (VWAP), it indicates that the asset is losing momentum and being traded lower than its average price level. This would represent a 'sell' opportunity for short-term momentum trader whom task is to trade following the trend while a longer term mean-revision trader might take it as a 'buy' opportunity, anticipating that the price of SRM (blue line) to rise to its average level (orange line).
As of 27 Feb 2022, VWAP is suggesting that although SRM is trading within its weekly volume-weighted average price range but it's still trading at a price that is way below its monthly volume-weighted average price range.
3.2. Moving Average Convergence Divergence (MACD)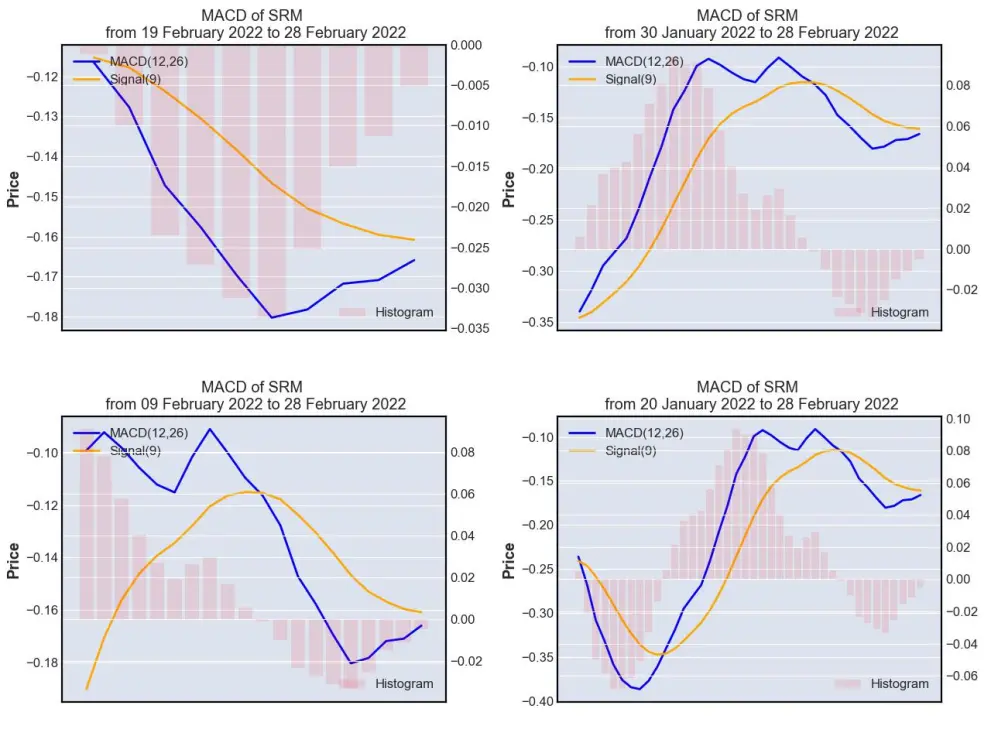
MACD is often used by trader as a momentum indicator. There are 2 lines that form the above charts, namely MACD (12, 26) lines and Signal(9) line, while the histogram is calculated by subtracting Signal (9) from MACD (12,26). Histogram would fall to the negative territory whenever MACD (12, 26) is trending at a lower level than Signal (9) and rise to the positive territory whenever MACD (12,26) is trending at a higher level than Signal (9).
MACD (12, 26) is computed by subtracting the 26-day exponential moving average (EMA) of SRM closing price from its 12-day EMA.
Signal (9) on the other hand is calculated as the 9-day EMA of MACD (12,26).
As MACD (12, 26) goes higher away from Signal (9), it signifies that SRM is gaining momentum and whenever it goes trends at a lower level than Signal (9),it signifies that SRM is losing momentum.
As of 27 Feb 2022, MACD is suggesting that SRM has regained momentum and is now trending upwards over the past few days.
3.3. Bollinger Band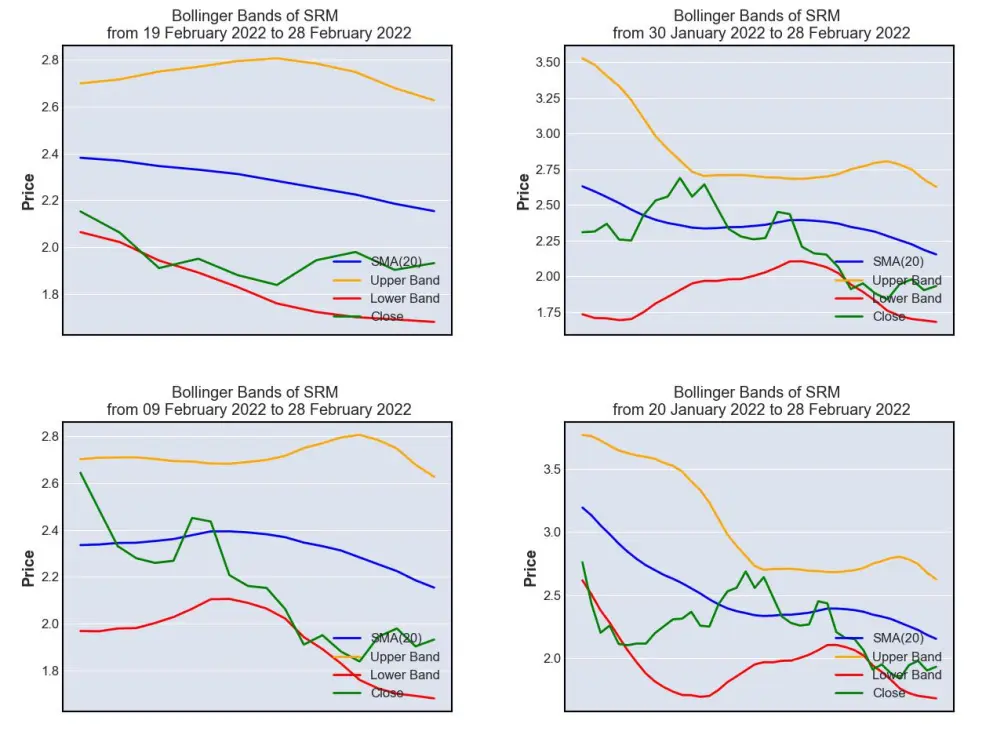
Bollinger band is often being used by mean-reversion trader as a gauge to assess how undervalued or overvalued an asset is. Its chart made up of 4 lines, namely:
- SMA (20) (blue line), which is the 20-day simple moving average price of SRM
- Upper Band (orange line), which is computed by adding 2 standard deviations of SRM on SMA (20)
- Lower Band (red line) , which is computed by subtracting 2 standard deviations of SRM from SMA (20)
- Close (green line), which is the daily closing price of SRM
Whenever close line (green) touches the lower band (red), it indicates that SRM is corrected too much and is being traded at an undervalued level, representing a 'buy' opportunity. On the other hand, whenever close line (green) touches the upper band (orange), it indicates that SRM is gaining too much momentum and is being traded at an overvalued level, thus indicating a 'sell' opportunity.
As of 27 Feb 2022, Bollinger Band is suggesting that SRM is oversold and is now trading near its support zone.
3.4. Relative Strength Index (RSI)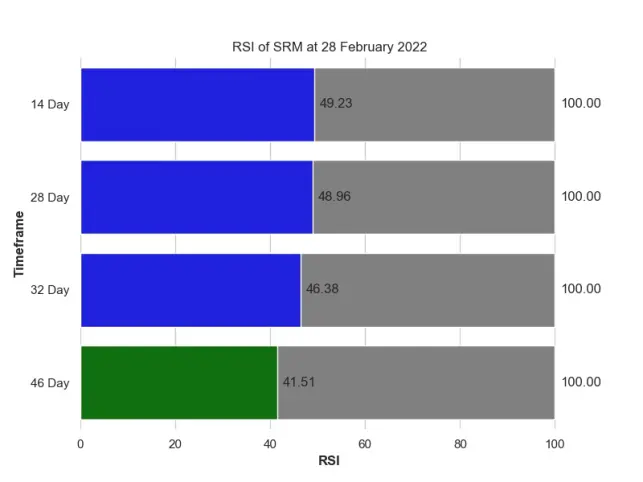
Just like Bollinger Band, Relative Strength Index is often being used by mean-reversion trader as a gauge to assess how undervalued or overvalued an asset is. There are 2 psychological levels, i.e. 30 and 70 in RSI. Whenever the RSI reaches 30, it indicates that SRM is corrected too much and is being traded at an undervalued level, representing a 'buy' opportunity. On the other hand, whenever RSI reaches 70, it indicates that SRM is gaining too much momentum and is being traded at an overvalued level, thus indicating a 'sell' opportunity.
As of 27 Feb 2022, RSI is suggesting that SRM is neither oversold nor overbought.
Based on the technical analysis presented above, quantdoge is bullish on Project Serum, but I could be wrong, hence please make your careful due diligence before making any financial decision.
4. Serum Risk Profile
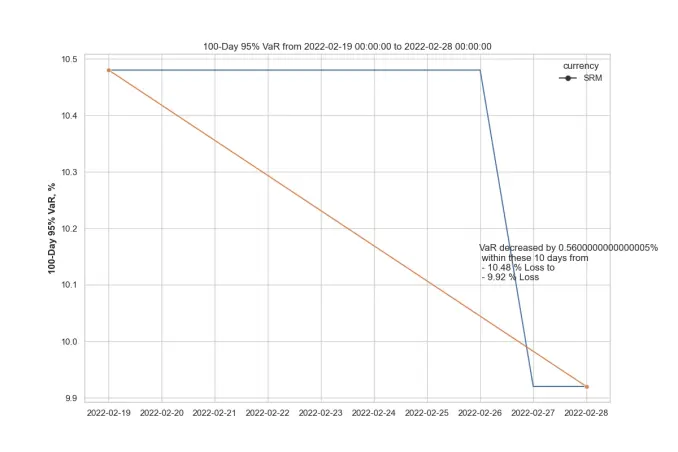
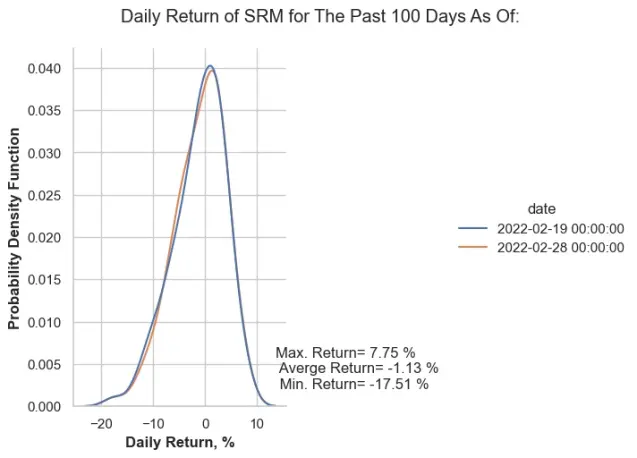
Based on the 100-day 95% historical Value-at-Risk (VaR) profile of Serum defined above, SRM seems to trade at a lower risk level on 27 Feb 2022 as compared to 10 days before on 17 Feb 2022, with its biggest pullback being seen at -17.51% on a single day during the last 100 days. However, I could be wrong, hence please make your careful due diligence before making any financial decision.
Based on the probability distribution chart of SRM's daily return, the chart has shifted right as compared to 10 days ago, where there is now a slightly lower chance for EGLD to lose 10% or more. This would mean that SRM is now relatively less riskier.
5. Google Trends Analytics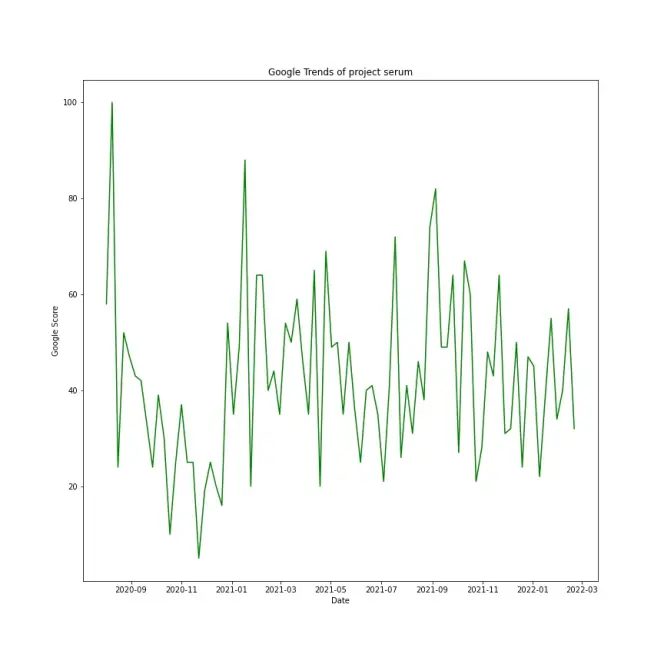
"project serum" reached its peak in Google Search on 2020-08-09 with a Google Score of 100
Over the last quarter, project serum Google Score has increased 12.42 % from 38.25 to 43.0
Over the last 6 months, project serum Google Score has decreased 29.51 % from 61.0 to 43.0
6. Binance Futures Activities
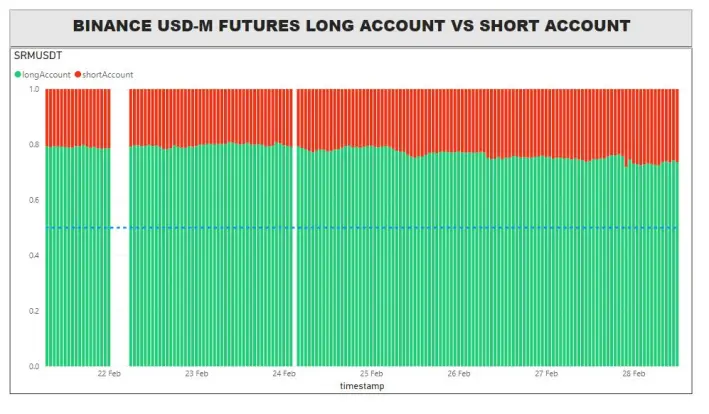
SRMUSDT futures have relatively more buyers than the sellers in this month of February. 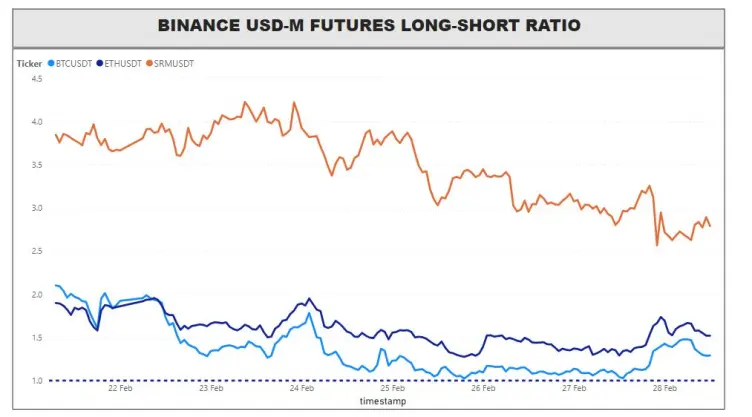
SRMUSDT long-short ratios remain consistently higher than BTCUSDT and ETHUSDT futures. However, in the final week of February, the long-short ratio of SRMUSDT futures was steadily declining, with long traders exiting their positions while short traders building up their short positions. Please take note that this long-short ratio is simply just dividing the number of accounts who are long by the number of accounts who are short, without taking any buy/ sell volume into consideration.
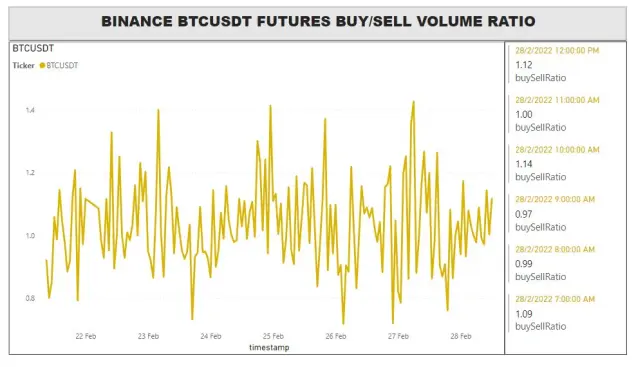
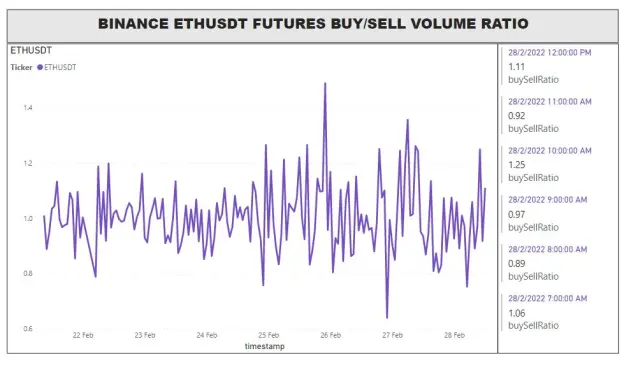
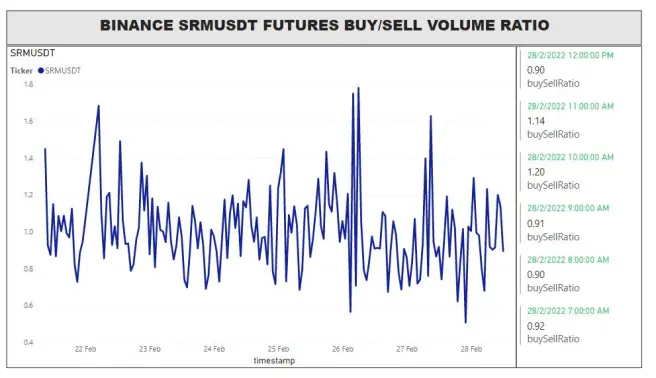
At the time of writing, the crypto futures market is in a "risk-off" mode now with sell volumes building up on more volatile SRMUSDT futures while the buy volumes were building up on the less volatile BTCUSDT and ETHUSDT futures for the past few hours.
If you like my analysis and articles, please follow me at @quantdoge for daily updates.
Follow My Twitter for daily updates: https://twitter.com/quantdoge





