
Investment Disclaimer:
- I am not a registered investment, legal, or tax adviser or a broker/dealer, and all opinions expressed by me are from my research for educational purposes only.
- Past performance presented here is not an indicator of future performance.
- This post expresses my own opinion about the cryptocurrency mentioned herein and is not an offer to buy or sell, or a solicitation of any offer to buy or sell the cryptocurrency mentioned in this post.
1. Top 3 Good News for LINK HODLERS !!!
-
How This Cardano Platform Will Benefit From Chainlink Oracles
Statistic as of 2021-04-27 11:39 AM: 38 positive votes, 4 negative votes
CardStarter will integrate Chainlink’s Verifiable Random Function (VRF). Thus, CardStarter will have access to Chainlink’s solutions. Its VRF will “guaranteed” that actions within this platform are fully randomized without any bias and protected against manipulation. CardStarter is an important part of Cardano’s ecosystem, via its decentralized platform project on this blockchain has a... (Read more on CryptoPanic) -
Chainlink 2.0 - The next generation of hybrid smart contracts
Statistic as of 2021-04-27 11:39 AM: 33 positive votes, 0 negative voteChainlink has released a new whitepaper called Chainlink 2.0: Next Steps in the Evolution of Decentralized Oracle Networks. The new whitepaper outlines an ambitious vision for the future of smart contracts. We talk with Chainlink co-founder Sergey Nazarov who explains the implications for the next generation of blockchain ecosystems. (Read more on CryptoPanic)
-
eToro Adds Chainlink And Uniswap Following An ‘Explosion In Retail Investor Appetite’
Statistic as of 2021-04-27 11:39 AM: 21 positive votes, 1 negative vote
The crypto market has been scoring huge wins of late as digital assets win in recognition in various economic sectors across the world. The latest break-through happens to involve one of the world’s largest online-based trading platforms, eToro. eToro has just announced the listing of Chainlink and Uniswap as part of the tradable digital assets […] (Read more on CryptoPanic)
2. How Chainlink Performs Relative to Other Cryptos ?
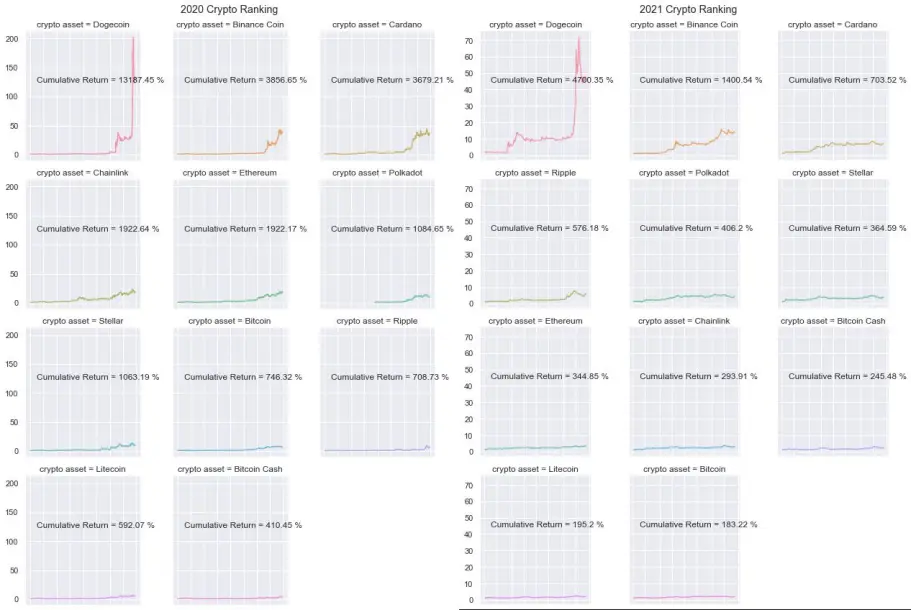
As of 21 April 2021, Chainlink has made a cumulative return of 1922.64% since Jan 2020 and 293.91% since Jan 2021. It is currently the 8th greatest performing crypto asset since Jan 2021 as compared to the other cryptocurrencies presented above.
3. Technical Analysis on Chainlink
3.1. Volume Weighted Average Price (VWAP)
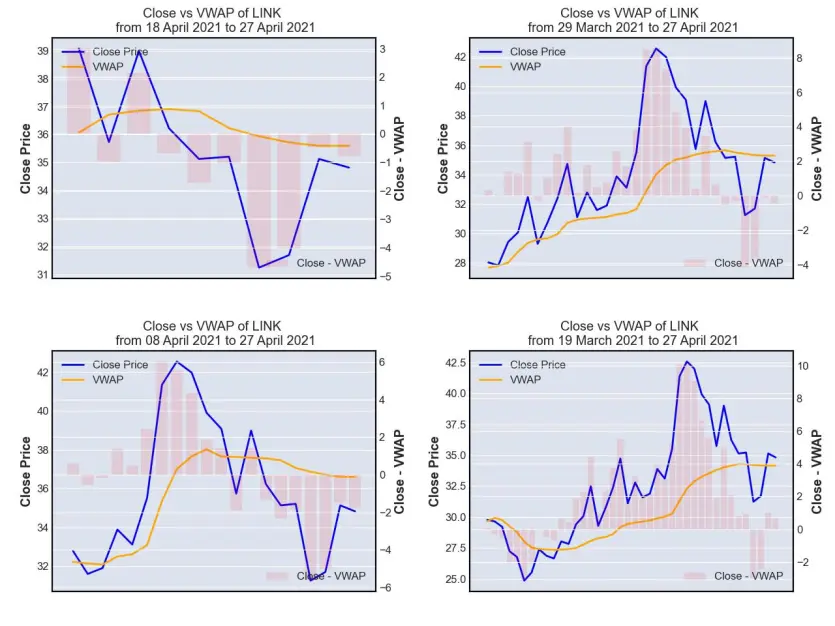
VWAP is a technical indicator used by a trader to gauge the overall trend of an asset price movement. VWAP line (orange line) represents the volume-weighted average price (average price here is defined as the average of high, low and close prices) while close price line (blue line) represents the price when LINK is closed at the end of every single day.
Whenever blue line (cross price) is above orange line (VWAP), it indicates that the asset is gaining momentum and being traded higher than its average price level. This would represent a 'buy' opportunity for short-term momentum trader whom task is to trade following the trend while a longer term mean-revision trader might take it as a 'sell' opportunity, anticipating that the price of LINK (blue line) to fall to its average level (orange line).
Whenever blue line (cross price) is below orange line (VWAP), it indicates that the asset is losing momentum and being traded lower than its average price level. This would represent a 'sell' opportunity for short-term momentum trader whom task is to trade following the trend while a longer term mean-revision trader might take it as a 'buy' opportunity, anticipating that the price of LINK (blue line) to rise to its average level (orange line).
On 27 April 2021, VWAP suggest that LINK is gaining momentum and traded at par with its average price range of USD 33 to USD 36.
3.2. Moving Average Convergence Divergence (MACD)
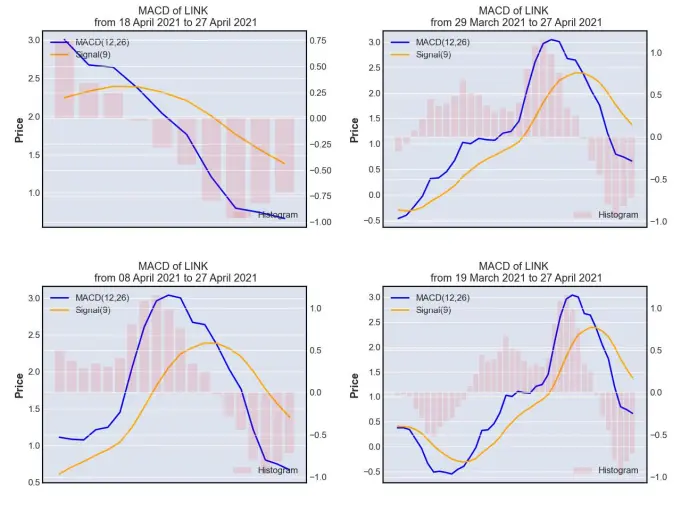
MACD is often used by trader as a momentum indicator. There are 2 lines that form the above charts, namely MACD (12, 26) lines and Signal(9) line, while the histogram is calculated by subtracting Signal (9) from MACD (12,26). Histogram would fall to the negative territory whenever MACD (12, 26) is trending at a lower level than Signal (9) and rise to the positive territory whenever MACD (12,26) is trending at a higher level than Signal (9).
MACD (12, 26) is computed by subtracting the 26-day exponential moving average (EMA) of LINK closing price from its 12-day EMA.
Signal (9) on the other hand is calculated as the 9-day EMA of MACD (12,26).
As MACD (12, 26) goes higher away from Signal (9), it signifies that LINK is gaining momentum and whenever it goes trends at a lower level than Signal (9),it signifies that LINK is losing momentum.
On 27 April 2021, MACD suggests that LINK is losing momentum and currently trending below its average momentum.
3.3. Bollinger Band
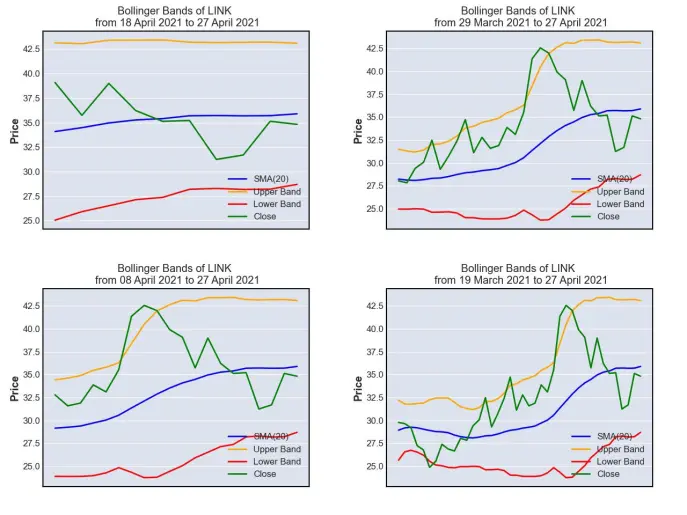
Bollinger band is often being used by mean-reversion trader as a gauge to assess how undervalued or overvalued an asset is. Its chart made up of 4 lines, namely:
- SMA (20) (blue line), which is the 20-day simple moving average price of LINK
- Upper Band (orange line), which is computed by adding 2 standard deviations of LINK on SMA (20)
- Lower Band (red line) , which is computed by subtracting 2 standard deviations of LINK from SMA (20)
- Close (green line), which is the daily closing price of LINK
Whenever close line (green) touches the lower band (red), it indicates that LINK is corrected too much and is being traded at an undervalued level, representing a 'buy' opportunity. On the other hand, whenever close line (green) touches the upper band (orange), it indicates that LINK is gaining too much momentum and is being traded at an overvalued level, thus indicating a 'sell' opportunity.
On 27 April 2021, Bollinger band suggests that LINK is trading at a fairly normal level (i.e. neither undervalued nor overvalued).
3.4. Relative Strength Index (RSI)
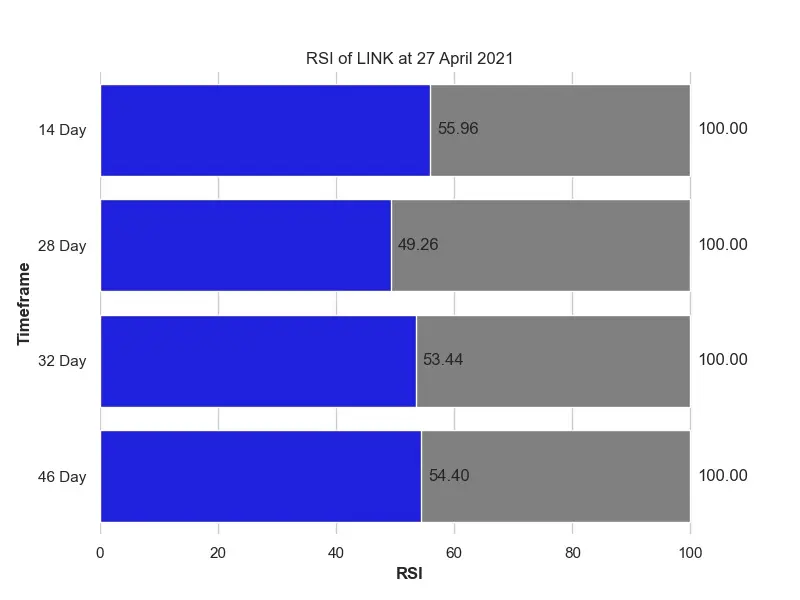
Just like Bollinger Band, Relative Strength Index is often being used by mean-reversion trader as a gauge to assess how undervalued or overvalued an asset is. There are 2 psychological levels, i.e. 30 and 70 in RSI. Whenever the RSI reaches 30, it indicates that LINK is corrected too much and is being traded at an undervalued level, representing a 'buy' opportunity. On the other hand, whenever RSI reaches 70, it indicates that LINK is gaining too much momentum and is being traded at an overvalued level, thus indicating a 'sell' opportunity.
On 27 April 2021, Bollinger band suggests that LINK is trading at a fairly normal level (i.e. neither undervalued nor overvalued), hovering around the neutral RSI points of 49 to 55.
Based on the technical analysis presented above, quantdoge holds a neutral stance on the short-term price outlook of Chainlink, but I could be wrong, hence please make your careful due diligence before making any financial decision.
4. Chainlink Risk Profile
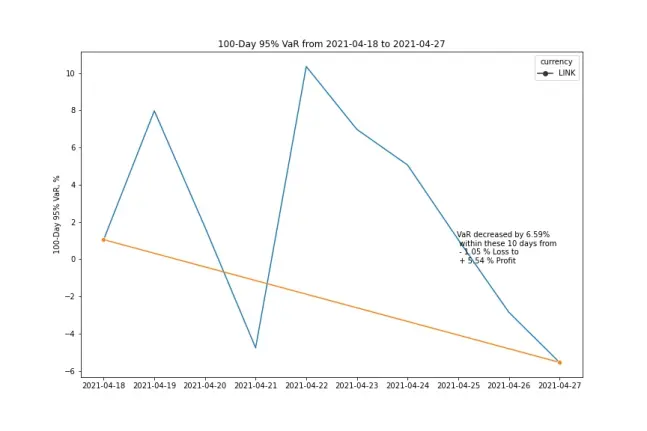
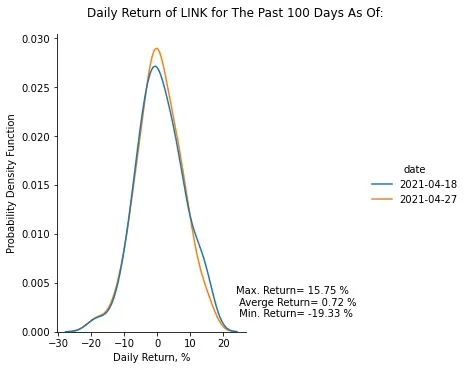
Based on the 100-day 95% historical Value-at-Risk (VaR) profile of Chainlink defined above, LINK seems to trade at a lower risk level on 27 Apr 2021 as compared to 10 days before on 18 Apr 2021, with its biggest pullback being seen at 19.33% on a single day during the last 100 days. However, I could be wrong, hence please make your careful due diligence before making any financial decision.
5. Price Simulation for Chainlink
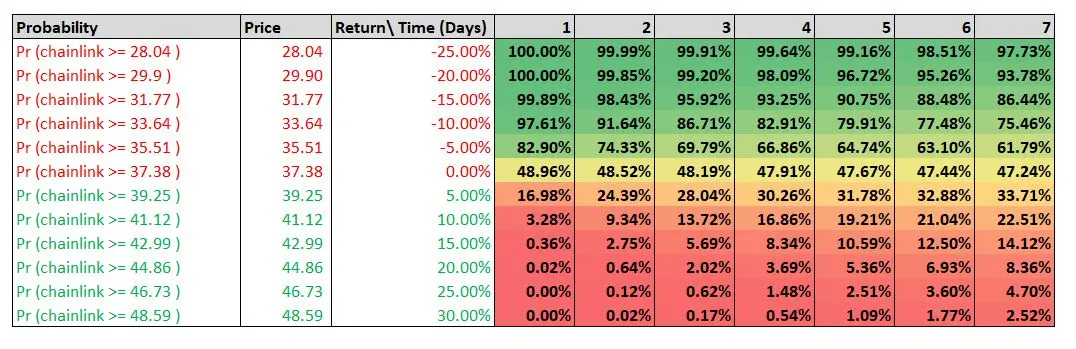

Are you looking for a crypto wallet which offers you an easy way to securely store your crypto while giving you the ability to earn crypto? Look no further than Coinbase, the cryptocurrency exchange and custody which has just went public in NASDAQ last week. You would get around USD 10 worth of free bitcoin if you sign up with my referral link below:
https://www.coinbase.com/join/lim_2kx
Besides, you would also be able to earn free cryptocurrencies via Coinbase Earn program where you need to do is just complete a series of short lessons about different cryptos.
If you are into Ethereum (ETH) and Binance Coin (BNB), I have made similar analysis on them at:
- 23 April 2021 (FRI)- Binance Coin (BNB) Daily Risk Report
- 23 April 2021 (FRI)- Ethereum (ETH) Daily Risk Report
If you like my analysis and articles, please follow me at @quantdoge for daily updates.






