
Today I want to read an interesting chart with you, Bitcoin Cash is one of the oldest crypto on the market and also a controversial one, anyway love or hate it BCH is there to stay for long time (I am not a fan and neither a hater of this currency), this chart is extremely interesting for the hyperbolic jump and fall, sometime it take few weeks or a month for pass from bullish to extremely bearish and vice versa.
Long Term Chart
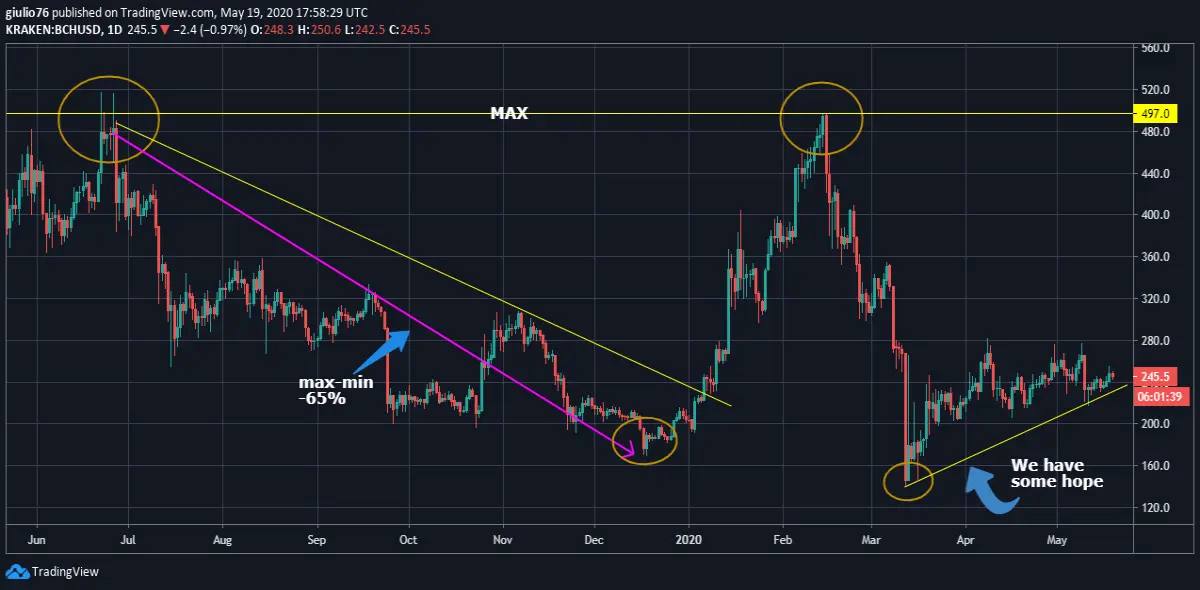
First we will take a look at the 1 year chart, we can notice that the maximum at 497 Dollar was touched two times and both times BCH was pushed down by bears in a very sharp way, on June 26 the price was to high and the pressure of the bears was to strong.
From that level we can see a down trend that takes roughly 5 and half month to find a bottom at around 175 Dollar, this represent a -65%, we see worse drawdown but this distribution phase was steady, the pressure on the valuation was so high that when the trendline breakout we can see a good explosion of volatility and price.
The second attempt to catch the 500 Dollar level failed was marked by a steep run to the top, we can focus at how many month the down trend takes to arrive at the bottom and how fast was the next uptrend.
Is likely that the run to the top at again 497 Dollar was to fast to hold the next bomb, as we all know the mid february was the start of a bloody downtrend that hit anything more or less at the same way, this way Bitcoin Cash find a bottom at 144 Dollar.
This movement marked a -71.2% that is impressive and also is a lower minimum than the last one, a bad signal for a long term macro trend, at this time is too early to say if we may loose the hope to see a cameback from the bottom but the reaction was not so good.
The next trendline we see in the last two month carry us to the short term analysis.
Short Term Chart
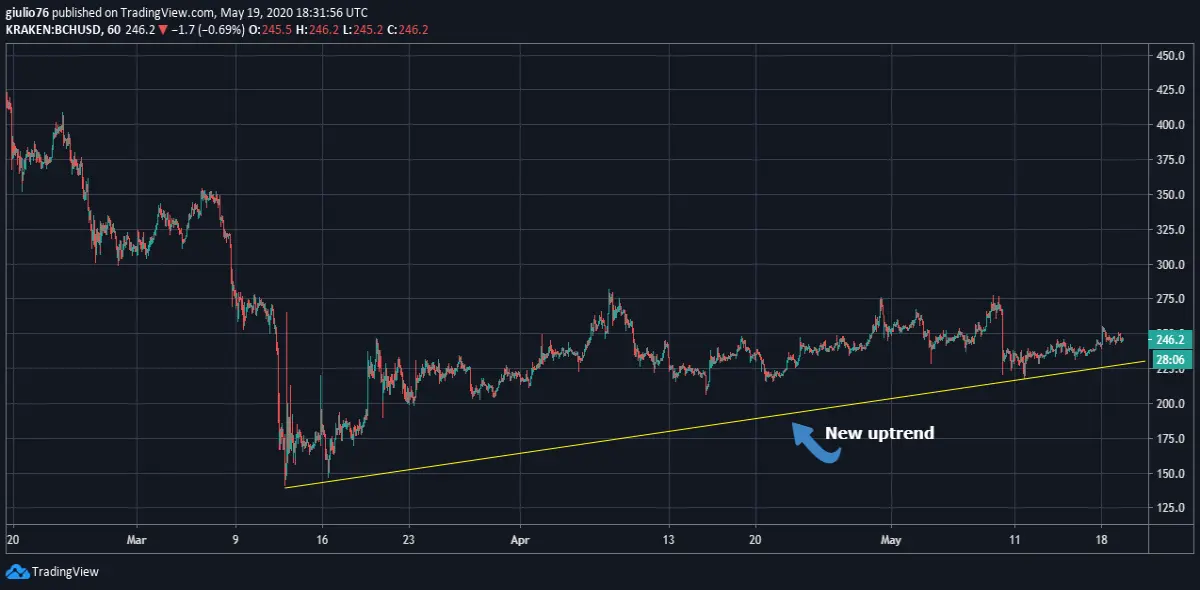
The trendline that we enjoy in the last two month is pretty regular and it’s a solid trend even if it rebound in a slow way, we have to forget for now the high volatility of last year, and focus on this couple of month, is highly possible that the trend will keep going in this direction than lets see next level where bulls and bears will find a resistance.
The first level I see is at 265 Dollar, this will be a resistance that would be passed in a easy way as the real threat is at 277 Dollar, here the battle between our bulls and bears will be interesting, this is a level that mark a possible run till 305 Dollar that is a price we not see till the start of march.
In the case that even this resistance will be reached and passed I don’t see much trouble till 355 Dollar.
With a crypto like Bitcoin Cash we may always expect a drawdown, the first stop of this hypothetical fall will find is at 230 Dollar, is a pretty close level and is not very difficult to break, the next at 215 instead is a prelude of a 198/200 Dollar support that may resist to the selling pressure if we don’t want to see a bad falling down to the 161 Dollar.
In my personal opinion this scenario is not very likely but we never know how the market can turn if the selling pressure return high.
Thanks for reading, I hope you find also this analysis useful and remember to do your own research before investing






