
Hey guys, I was just analyzing the BAT/USD charts and something came to my mind. I will try to be very straight forward here.
So, basically I was checking the charts from March 2020 until the end of May 2020. I'll be simple so don't worry if you don't understand what the image shows. For you to know: these green and yellow icons are called candles, and they indicates if the price is going up or down in the time you selected. For this example, I used a 2 day candle for easier analysis.
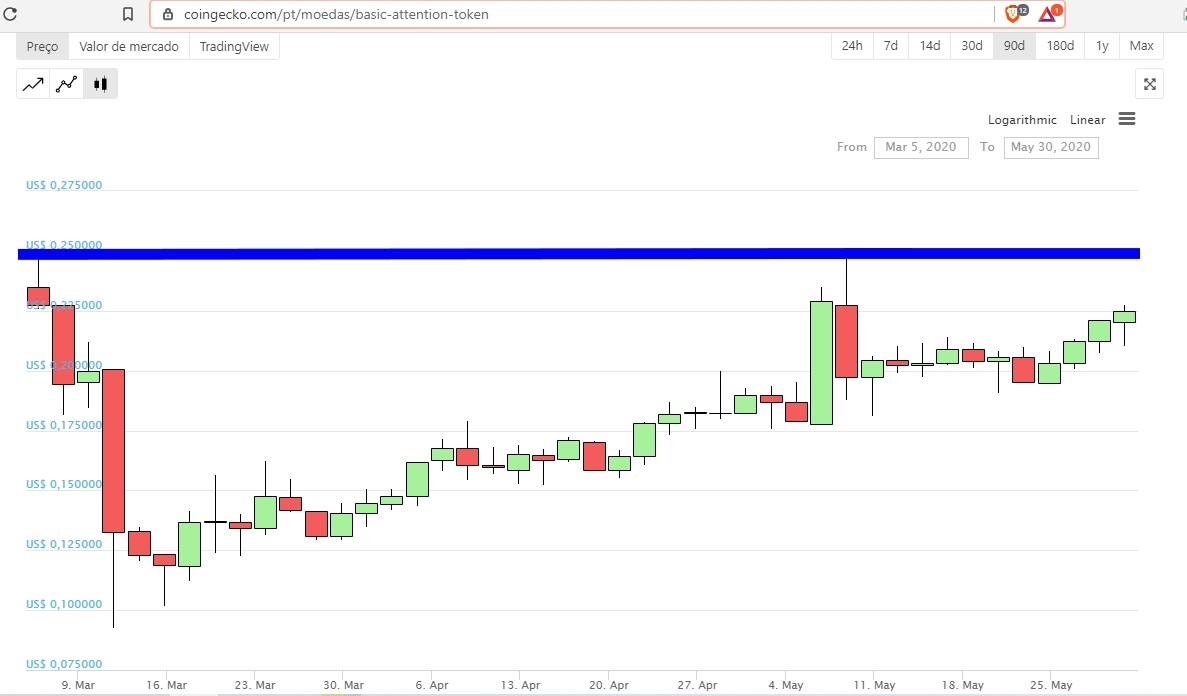
Now, notice the blue line? It is what traders call a resistance. It's like a maximum point were a price is supposed to get. This resistance has been hitted in March 6, dropped a lot in a retraction, but again in May 8 and dropped a little bit.
What does that mean? If you look at the candles, they are tending to go up, and at that speed they are probably going to hit that resistance again somewhere between June and July. If that happens, BAT will be worth 24 cents.
But what happens next?
Well, it is hard to say. The candles can either break that resistance and keep going up, or retract down a little bit in order to go up again in the future. In my personal opinion, it is strong enough to touch and break it in the next weeks, even if it touches the resistance and retracts a little, can be back again right after. If it really breaks, BAT price could go even for the 27 cents, what definitely would be something. But I must say: I am not a professional analyst.
What do you think? Can the BAT price really hit theses values?
UPDATE: Today, 4th of June and two days after this article was published, BAT is worth U$0,24 :)


