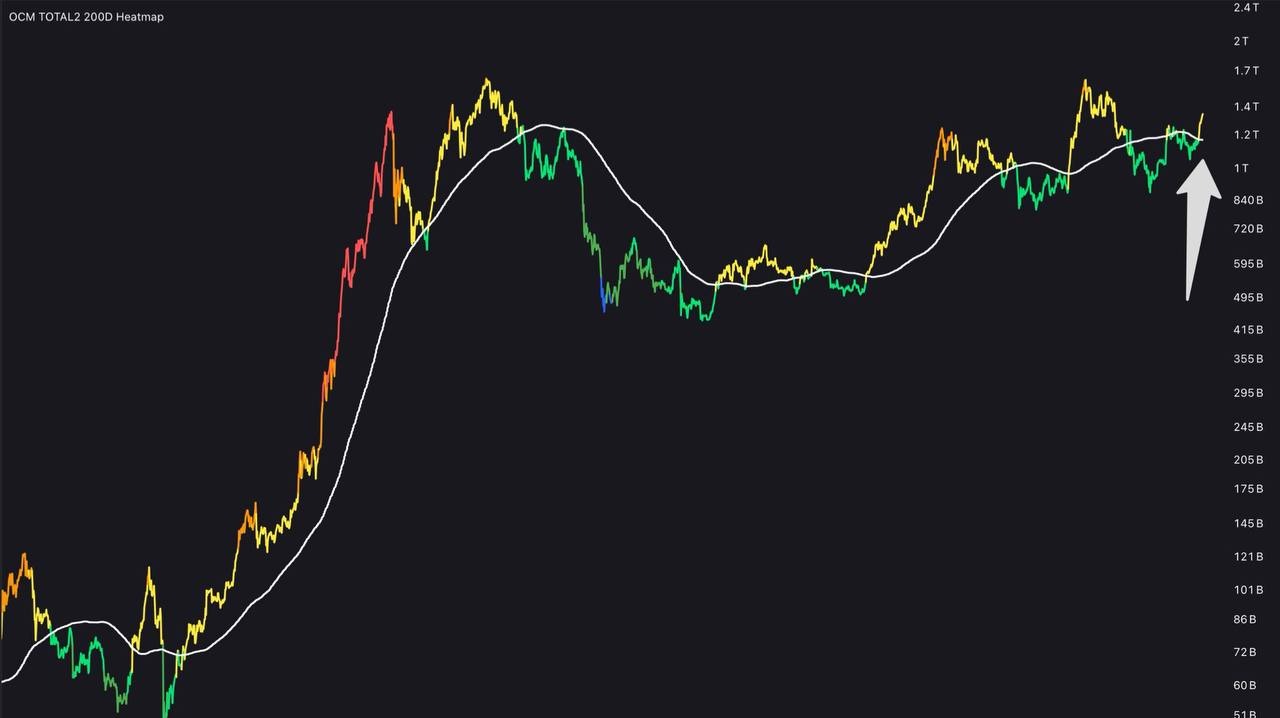
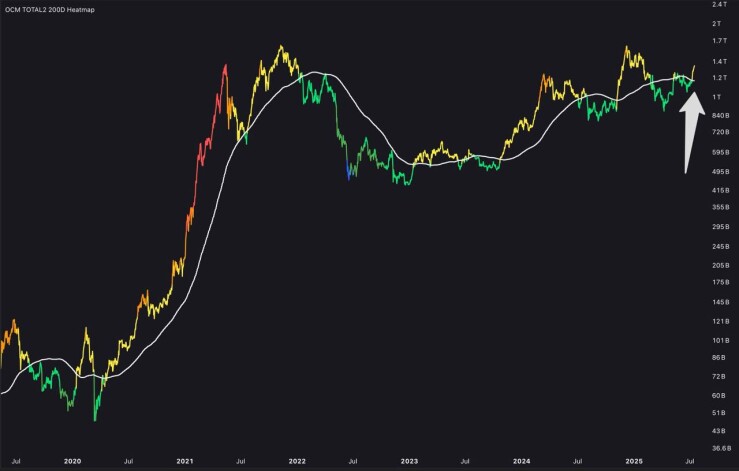
A subtle but seismic shift is unfolding across crypto markets. The TOTAL2 index – representing the combined market cap of every cryptocurrency except Bitcoin – has decisively reclaimed its 200-day moving average. This technical milestone, while easily overlooked, carries profound implications. History shows that when alts collectively climb above this long-term trend line, capital begins migrating from Bitcoin’s relative safety toward riskier assets. We’ve seen this script play out before: in 2020, this crossover ignited DeFi Summer; in 2021, it fueled the NFT and metaverse frenzy. Even during the false starts of 2023-2024, the 200MA served as the dividing line between hope and capitulation.
What makes today different is the confluence of confirming signals. Bitcoin’s dominance has rolled over from its April peak near 58%, now testing the 52% support level. Meanwhile, the ETH/BTC pair – crypto’s most critical ratio – is rebounding from a nine-year trendline that’s held through multiple market cycles. Beneath the surface, liquidity is building: over $7 billion in new stablecoin issuance this quarter alone, the highest since late 2023. These aren’t isolated events; they’re chapters in a larger story of rotation.
For investors, this moves the conversation beyond whether an altseason has started to how to navigate its velocity. Early phases typically favor infrastructure tokens – layer-2 solutions like Arbitrum and Polygon, or liquid staking protocols. As momentum builds, capital typically flows toward AI and DePIN projects (Render, Fetch.ai) before eventually reaching the speculative froth of memecoins. The difference between catching 3x moves and life-changing 30x returns often comes down to three factors: precise sector selection, disciplined leverage management, and pre-defined exit strategies.
Tracking the Turning Point
You can monitor this pivotal metric directly on TradingView. Plot the TOTAL2 index, then overlay a simple 200-day moving average. Many traders enhance visibility with custom scripts like OCM Heatmap – searchable in the public library – which color-code closes relative to the trend line. The current setup shows the index not just crossing but accelerating away from its 200MA, with volume running 22% above the 90-day average. These are the technical footprints of institutional accumulation.
The Critical Path Ahead
Three signals will confirm whether this breakout holds:
-
Sustained TOTAL2 closes above $1.15 trillion
-
Bitcoin maintaining its $110,000 support floor
-
Rising funding rates for altcoin perpetual contracts
The greatest risk now isn’t missing the rally – it’s mistaking a rotation for a revolution. True altseasons require Bitcoin stability, not weakness. If BTC craters, alts will follow faster and harder. This is why seasoned traders limit altcoin exposure to 40% of portfolios during rotation phases, trailing stop-losses at TOTAL2’s 20-day moving average, and systematically recycling profits back into Bitcoin when dominance finds support.
We stand at that rare moment where technicals, liquidity, and sentiment converge. The 200-day MA breach isn’t a starting gun – it’s the opening of a window. What happens next depends less on the market than on the hands holding the assets.