
Selling pressure on Bitcoin continues uninterrupted during these first six days of June, with the price hitting a new annual low at 59,130 USDT and marking its fourth consecutive week in the red.
Currently trading at 61,000 USDT, BTC's weekly candle stands at -17.50%. This is a decline that Bitcoin hasn't recorded since November 2022, during the collapse of FTX and Alameda Research. Since the beginning of 2026, BTC's drop has reached -30.65%.
Bitcoin crashes to 60,000 USDT
The monthly chart offers a merciless picture of the ongoing crash affecting Bitcoin. Shown here is the overview of the movement that started from the old all-time high of 69,000 USDT in November 2021, followed by the subsequent contraction phase that led to the low of 15,479 USDT in November 2022.
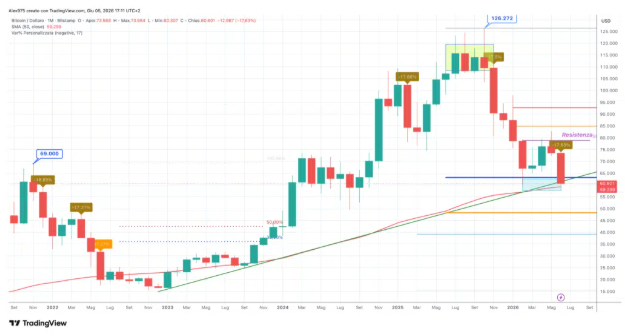
From that low area, BTC’s recovery began, developing through a series of swings with higher highs and higher lows over more than two years. This movement led to a succession of new ATHs, culminating in the all-time high of 126,272 USDT in October 2025. From that peak, the current downward phase began, which now sees Bitcoin down by approximately -52% compared to its ATH.
The critical support
The price has returned to a critical support zone already tested in February, sitting between 60,000 and 61,000 USDT. The 50% Fibonacci retracement level passes through this area, calculated from Bitcoin's historical lows up to its latest ATH.
As can be observed from the chart, the monthly 50 SMA (highlighted in red) also crosses this exact same area. Furthermore, there is the long-term dynamic support trendline (highlighted in green). The simultaneous loss of these three elements could trigger a further bearish acceleration in BTC's price, opening the door to deeper corrective scenarios, which we will analyze later.
Seasonal statistics are confirmed
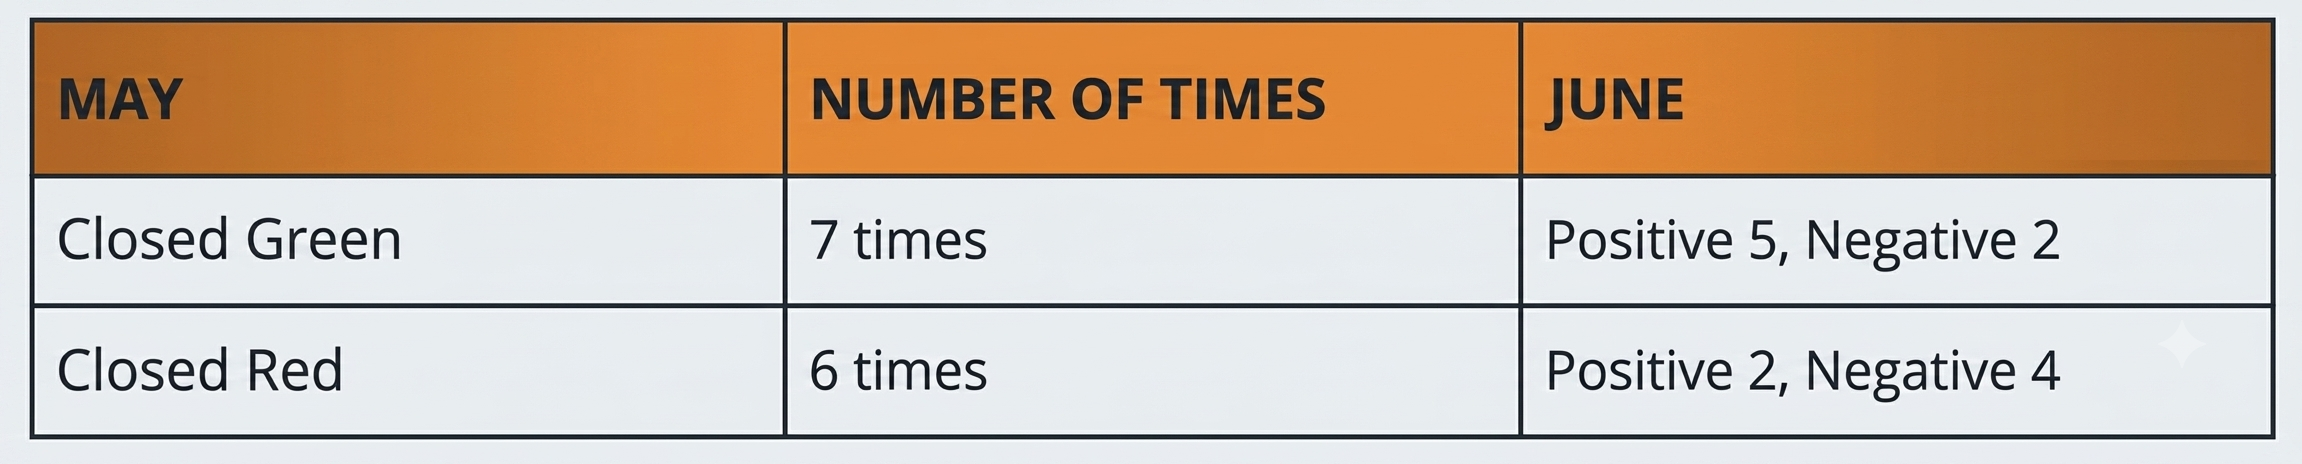
In our analysis back on May 23rd, we highlighted a seasonal statistic for Bitcoin. Over a thirteen-year history, whenever May closed in the red, June continued downward four out of six times. The same trend applied to the entire second quarter.
That scenario is now playing out. May 2026 closed negative at -3.41%. June, which is still underway, already marks a 16% decline. For now, this historical trend is finding precise confirmation on the daily chart.
For a broader overview of the current situation and further downside risks for Bitcoin, we also include a Head & Shoulders pattern published on February 6th. This pattern has now been activated by the neckline breakout recorded at the end of January.
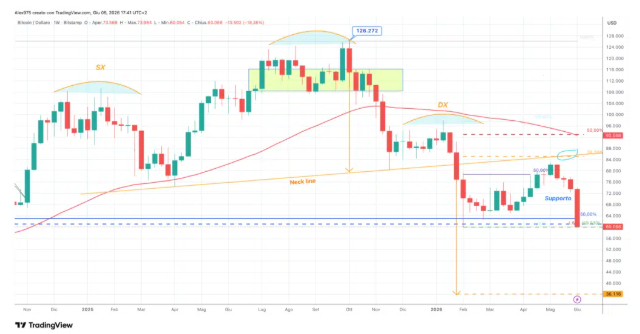
From the chart, it can be observed how Bitcoin, after touching lows in the 60,000 USDT area, initiated a prolonged rebound phase between April and mid-May. This recovery had pushed the price toward the pattern's neckline, corresponding to the first vector resistance in the 85,000 USDT area.
The technical target of Bitcoin's decline
However, BTC failed to reach that selling level. The price began to reverse direction early, subsequently accelerating downward. The theoretical projection of the Head & Shoulders pattern identifies a possible target between 36,000 and 37,000 USDT.
This would represent a further decline of approximately -39% from current levels. Furthermore, this percentage drop is consistent with certain technical levels that also emerged in the Ethereum analysis.