
Hello Crypto friends, and welcome to my blog!
This is my first post. i have created a blog in the hope i can pass on my knowledge and experience in the trading game of Cryptocurrency!
I thought as a starting point i would share my daily habit and routine of how i assess a chart to then executing a calculated and well timed trade in the hope of beating down this monster that is the cryptosphere trading game!
This is about daytrading, otherwise known as scalping (short term trades that get you in and out within a day), next time i will also make a post about swing trading which is longer term trades.
So, lets begin the day!
8-9am (Australia time) - Wake up, grab some breakfast and an espresso, need to fuel the brain and body for the oncoming strenuous task ahead.
9.30am - Comb the internet, mostly Youtube, see what is happening in the news and how other traders are approaching the market.
11am - This is the daily closing time here in Oz. this is the critical point in which to start hunting a trade. We must survey the battlefield, who is winning? The Bulls or the Bears????
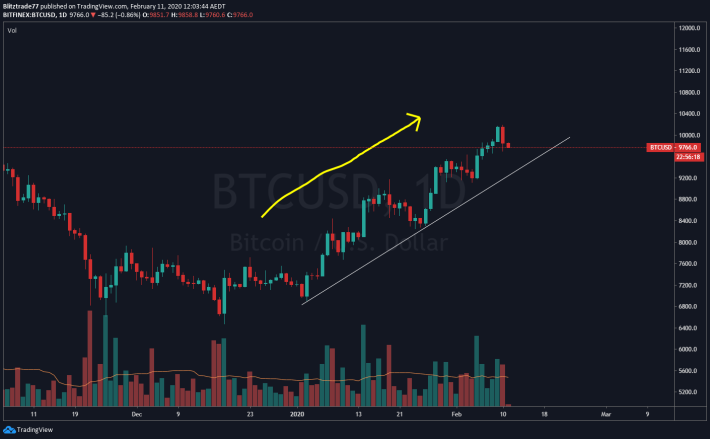
its fairly obvious the Bulls are in control. The trend is up. However, we closed the day on a big RED candle......
Next step: Find some key levels of support and resistance.
Starting with the weekly chart-
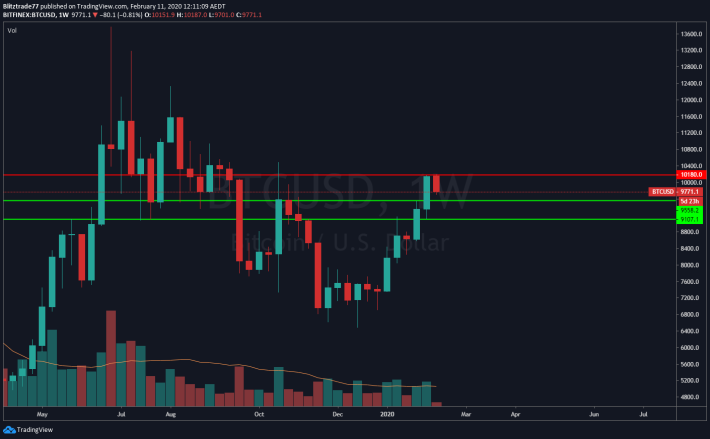
By looking left into the past we can see some key levels on the chart for Bitcoin. These are major areas. The Red is marked as Resistance, the green is marked as support.
Next the daily -
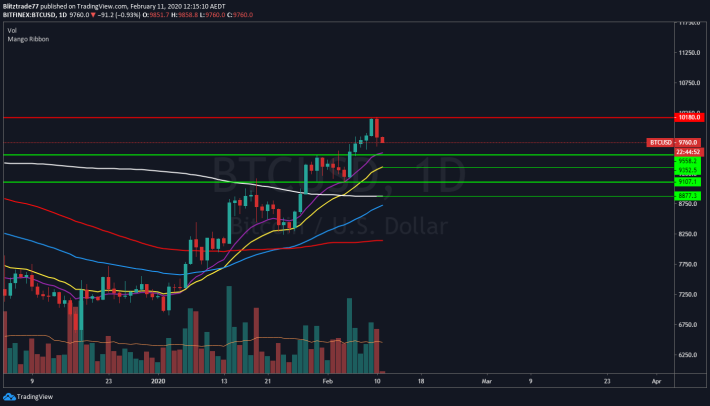
We can see how those weekly levels are respected on the daily chart. I have now added some Moving averages. I use the 13,21 and 55 EMA's and also the 100 and 200 SMA's.
We can see the 13 is lining up with our weekly support and looks like a good battlefield for a skirmish.
I have marked in a couple of lines on the next closest moving averages in case the bears win the first battle!
Onto the 4hr chart -

Now i add in some dotted lines on the 4hr moving averages which don't line up with the daily. This plots us the areas of concern. Above us is the fast moving averages (13+21) marked with a red dotted line which shows downward momentum.
We can see now that the lower time frames are trending downwards and we should maybe look to short this market, time to team up with the bears?!
1hr chart-
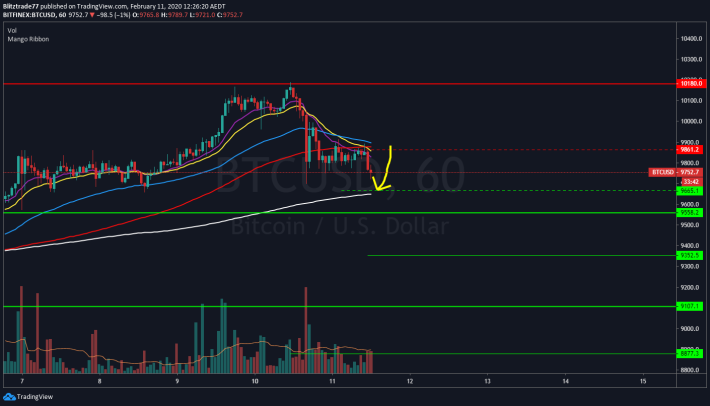
Now we have some nice areas of confluence. Target confirmed.
Lets try and hunt some profits for the day. To do that i will use the 15 mins chart to find some good entries and exits. Time to pull up some indicators. I use the RSI, MFI and MACD
15 min chart-

I now put in a white line at the area of confluence between the moving averages and candle closes. I can see all the indicators are down. It could be a good time for the price to come up abit to our area of confluence. This would be a good entry point.
Now i will look for my entry point and mark it out.
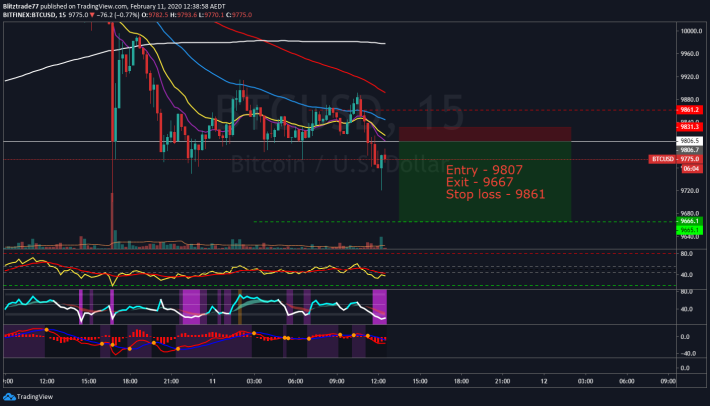
Now time for some calculations. If i have $1000 balance and i want to use 5% as my risk then the calculation goes as follows-
1000 x 0.05= $50
$50 divided by the stop loss percentage 50/0.0025 = 20,000
(I am using Derivatives- futures i normally use 75-100X leverage.)
So the trade is
20,000 contracts order sell at $9807. The Stop loss is at $9861 and the exit is at $9667.
Potential loss is $50, potential gain is $280.
Our battlefield is determined, our strategy is lined out. Now we sit and wait, and survey the war! Go the bears!!
What we are looking for is the indicators to come up a bit as they are looking tired down there. Lets see what happens after 30 mins.
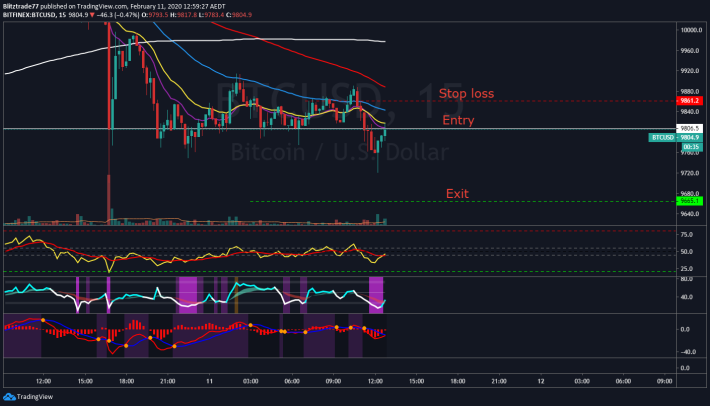
Ok we are in the game!!! The indicators have come up/cooled off, the price has hit the moving averages and our low time frame resistance.
Time to watch some netflix and leave the Bulls and the Bears to fight it out.
Just a quick update/check on the trade. Its been nearly 2 hours and we are in profit!
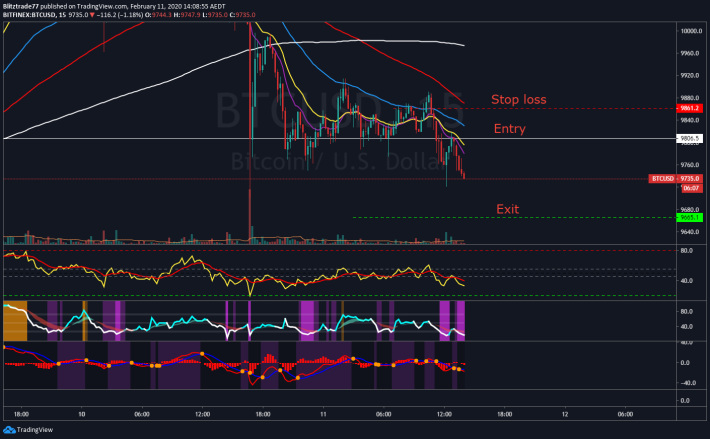
In the midway point here, about to hit the point of that last wick down from previously. At this point i don't want to lose anything so moving my stop loss to my entry point.
So at 4pm i have an update to my trade. It has not hit target. the price has formed a falling wedge on the hourly and has broken out of this pattern, which normally means price will come back to around the top of the wedge pattern. Therefore i closed my trade with $100 profit.
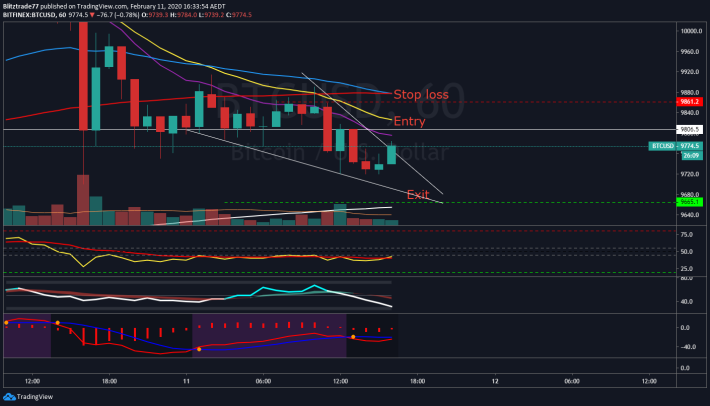
In spite of this i will now enter a long position and hopefully get an extra $100 profit in the other direction.
And there u have it. A Day in the life of trading crypto. I hope this helps people and i am more than happy to explain anything in this post.
Good luck and happy trading!


