
Hello Crypto Friends!
Wow, what a crazy few days we have had. Its been tough, especially if you are a hodler!
On the other hand for traders this is one of the best times to be in the market. The crazy price swings happening are making short term trades very profitable.
Lets start with BTC -
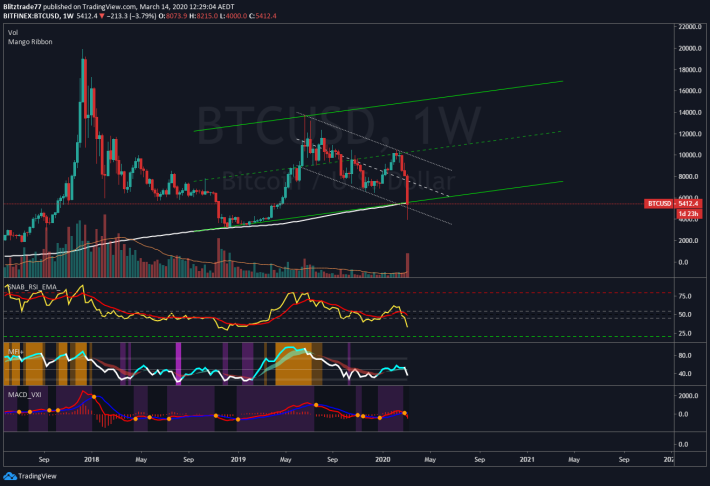
On the weekly. Currently battling with the 200 SMA. We are in this descending channel, currently testing the bottom of it, which could be part of a massive ascending channel, if this price point holds.......
So here is the bullish scenario -
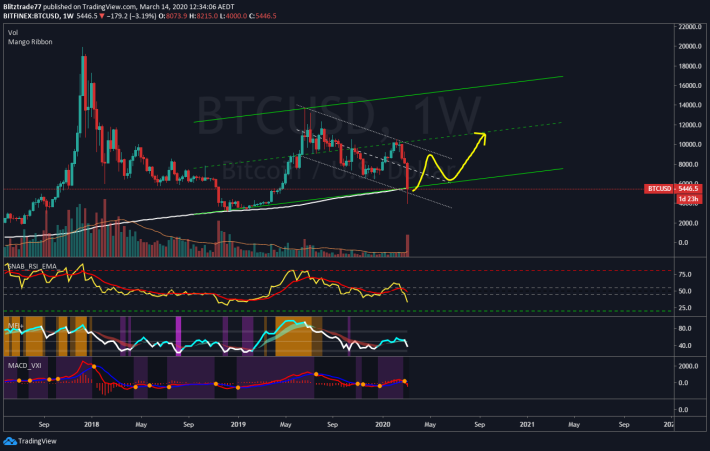
The 200 MA holds, and we get a "dead cat bounce" in the following weeks. Which eventually gets rejected by the top of the channel. This actually lines up with the halving, touching the top of the channel around the end of April.
Then we get a sell off, but supported on the larger channel bottom, to then start the bull run with a big weekly "W" action.
Lets put some fibs on this too -
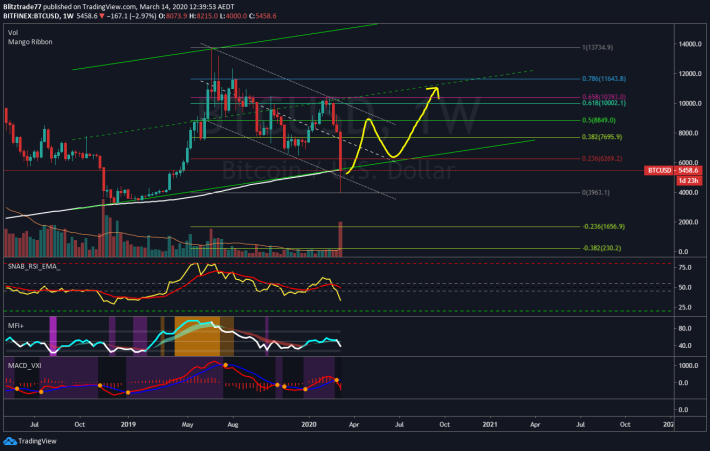
So, currently around the 786 (line in the sand). A bounce to the 0.5 at around $8850 would be the top of the channel. then down to the 236 at around $6270.
Lets look at the Bearish scenario-

Bitcoin closes below the 200MA and continues down, there are certain levels of support, marked out. We could double bottom, and find the price at around $3200, or it could come down to the bottom of the channel around $2200.
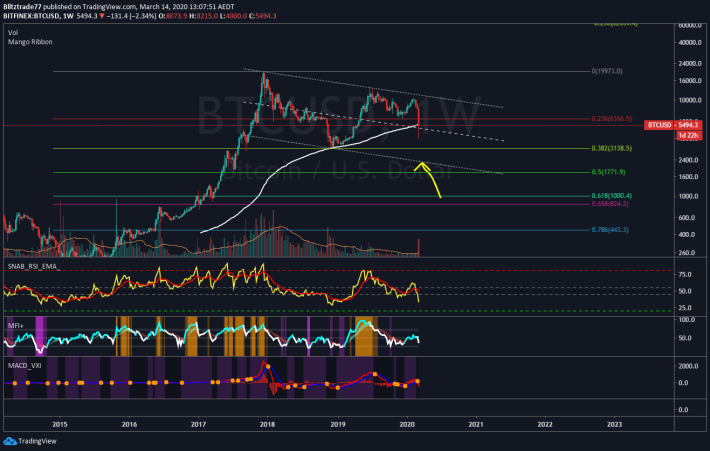
If we look at fibs, the 382 was our bottom in 2018, next is the 0.5 at 1770, and below that the golden pocket at 1k.
Personally i don't see 1k anytime soon. We could hit the 1770.
If we look at the RSI -
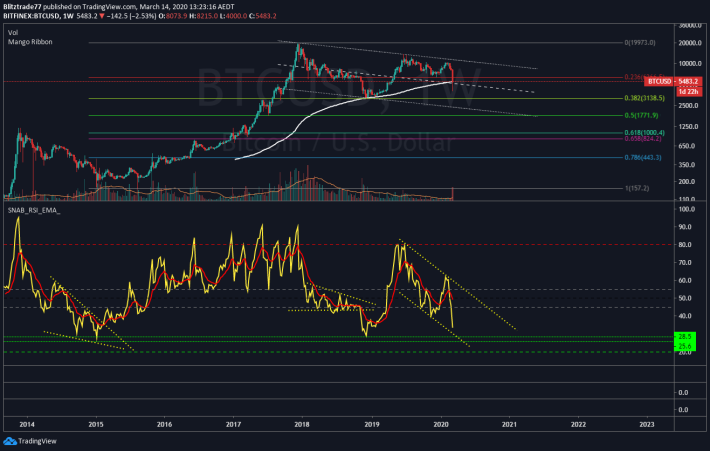
We can see there is some room to drop, untill we reach historical bottoming levels, but not too much room as you can see in the channel.
What we could hope for is a low of $3200, with a higher low on the RSI, giving a nice bullish divergence on a weekly chart, that would be a very bullish outlook for the future.
If we held the 200 MA and started the bullish scenario from above, we could see a falling wedge pattern appear in the RSI.
Lets quickly look at an interesting daily chart -
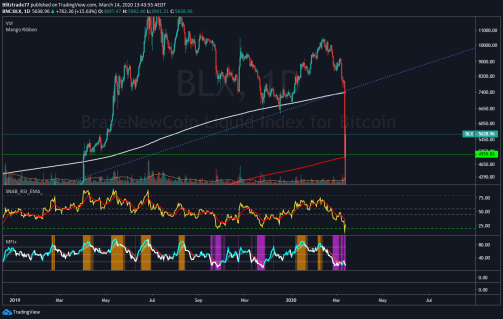

The first pic is using 2 Fibonnaci numbers as SMA's. The 987 was support on the last bottom, which when broken came down to the next fib number of 1597. Currently sitting on it. In the second picture we have the next fib number (2584) sitting right at our previous bottom $3150.
Also on the hourly, it looks like a head and shoulder, with the target being the bottom of the old trend line....

Food for thought!
Happy Trading!


