
Is support and resistance so important?
Support and resistance are two of the most frequent forex terms you will come across in technical analysis. Simply put, support refers to a floor in price action where a downward movement changes course. On the other hand, resistance stands for a ceiling in price action where an upward movement reverses.
A good rule of thumb for identifying support and resistance levels is waiting for a couple of tests or bounces, which indicate that the levels are holding. However, as the number of bounces off those levels increase, so does the probability of breaking in the next tests.
 When support or resistance levels do break, they tend to flip roles especially when there is trending market behavior. In particular, when a support level breaks during a downtrend, it could act as resistance for future price action. When a resistance level is broken during an uptrend, it may act as support for later movements.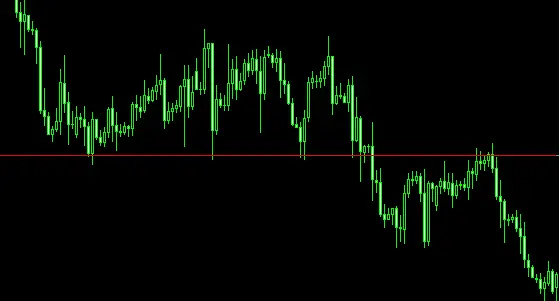
False breakout
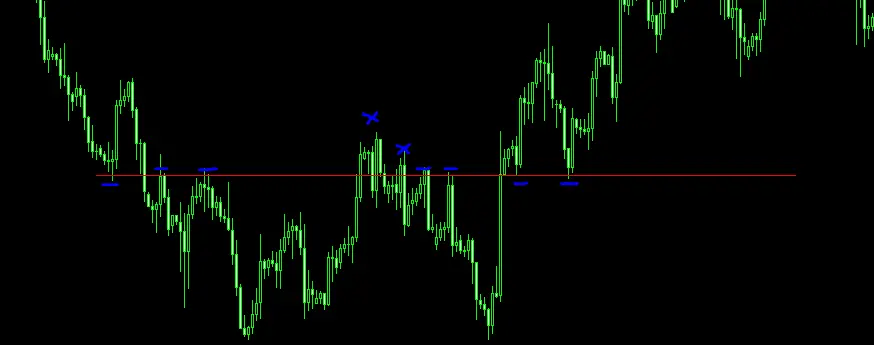
What you should be careful of though is fakeouts or false breakouts. There may be instances when it appears that price action is already making a break above resistance or below support, but you should look at the close of longer-term candlesticks to determine whether those inflection points have been broken or not.
Support and resistance aren’t always the price level
Another thing to remember is that support and resistance are not always horizontal levels, although those are the most basic and commonly seen inflection points. Support and resistance can come in the form of trend lines or channels, which are diagonal lines connecting recent price highs or lows. Moving averages or other technical indicators may also act as dynamic support and resistance levels.
Indicators and tools as aids
There are other technical tools that can be employed to calculate potential support and resistance levels, even if these floors and ceilings haven’t been established by past price action. For intraday traders, pivot points are typically calculated using various formulas to identify potential barriers for price action for that particular trading day.
In addition, Fibonacci retracement and extension tools can be used to pinpoint potential support and resistance as the market trend progresses. When these line up with horizontal levels or other possible inflection points, they tend to act as stronger floors or ceilings for price movement.
Do you want to know more? I can write more articles on technical analysis. And not only;)






