
Introduction
Ripple (XRP) in 2019 so far shows a drop of approximately 30% seems a disastrous scenario for a cryptocurrency, as I could gain from this devaluation of this asset is what I want to clarify in this article.
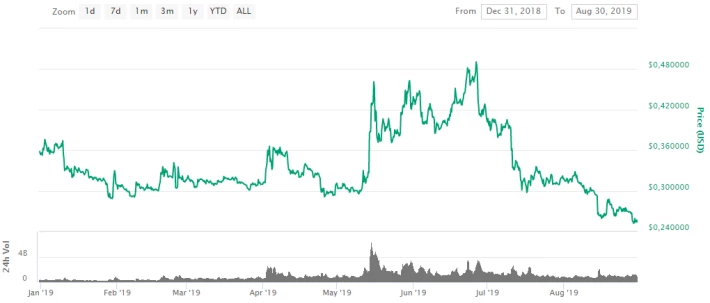
During this simple visualization it is possible to identify several pumps that together make a very big gain if you are trading this asset.
Graphical analysis
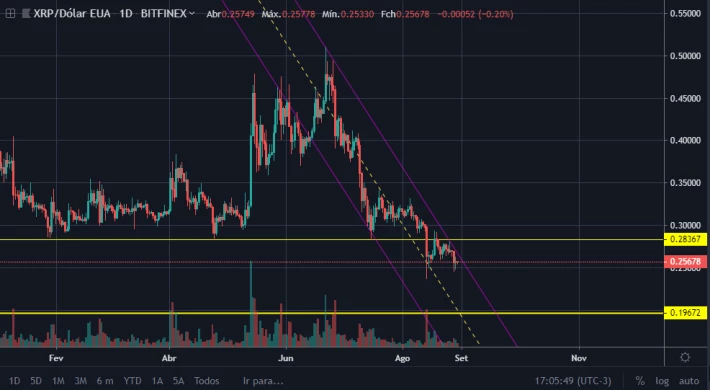
Since my last analysis Ripple has broken a major support at around $ 0.28 and is now trying to break weak support at around $ 0.25 and its next move will be towards 0.19 so we might see a reaction. With the current BTC drop below $ 10k we are seeing all the altcoins falling next to it so it's likely that the reversal of the XRP will happen next to bitcoin.
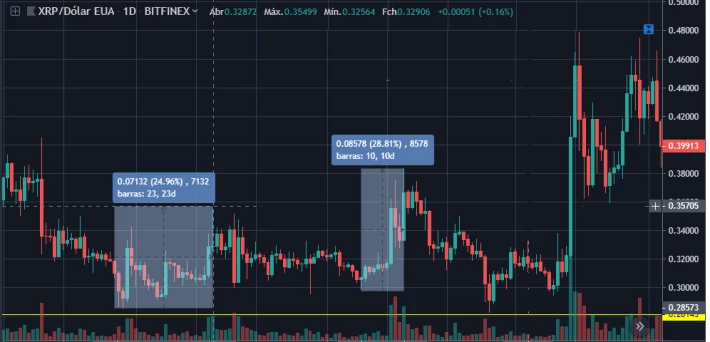
These points can be found at numerous points on the chart if there is a thorough analysis, my point is that XRP price volatility provides a quick access point for swing traders to make big profits.
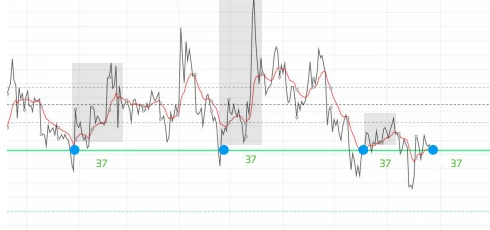
Here's a big insight into negotiating the XRP and keeping your results consistent: You can identify the times when the pumps present the RSI indicates 37, then do your analysis with that factor in mind. These other indicators that can be displayed after being important always make a thorough and meticulous analysis, never rely solely on one indicator to do your business.
Thank you for reading :D






