
Introduction
Banano is a very interesting project that goes beyond innovative technology and brings with it the meme proposal which, in turn, is different from projects solely with the meme proposal, such as the doge which is an ultra inflationary currency. The community that is forming around Banano is amazing (although they are mostly hodlers, which in my opinion does not add so much when it comes to raising the value of the currency), always promoting relevant discussions and laughter in the telegram and discord groups. Finally, if you want to know more about the project you can read this other article I wrote about her and NANO.
Analysis
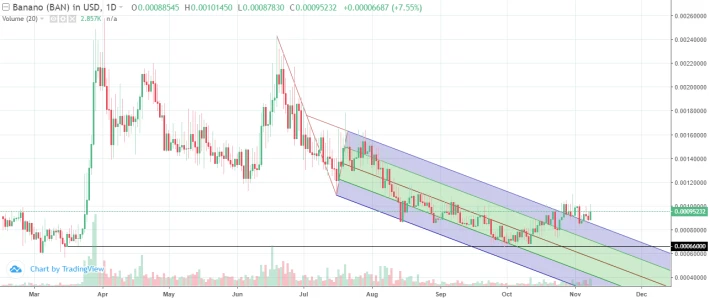
It is possible to observe that for some time now BAN took a downward channel that has just been broken, the possible fund formed by the price was given by a resistance formed at the beginning of the price formation of the currency.
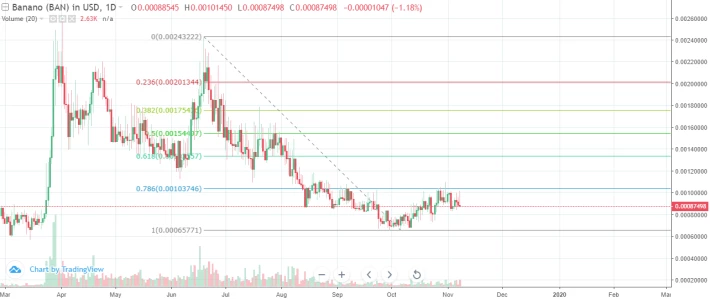
Plotting a fibonacci from the time it actually started the fall has the point that 0.786 is serving as resistance to the price, and if we look at the chart's past we can see that this could be a key point indicating the trend reversal, while the price if you stay lateralized within this fibonacci region we only know that the downtrend has lost strength but no reversal has happened so on break we can have a possible confirmation that this is happening.
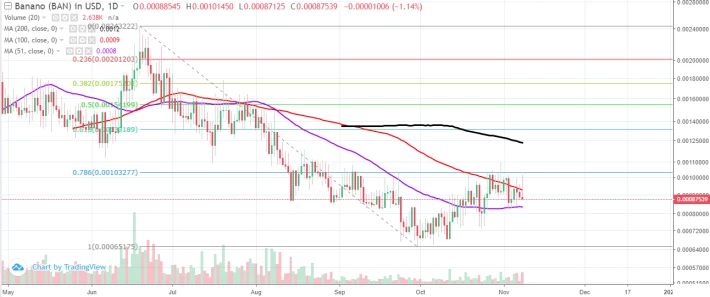
Applying the moving averages of 200 periods (black), 100 periods (red) and 51 periods (purple) we can observe some interesting aspects that may give us information about the future of the chart. First we note that the 200 period moving average is sloping negatively which by default is a bearish signal, in contrast we have the 51 period moving average which started to support the price after a long time without it and the average 100-period moving serving as price resistance, note that these two moving averages are funneling close to converging, as the 51 moving average crosses 100-up, it may signal bulls taking the reins making the price rise again strongly, when that happens the ideal is that the price is already being supported by the moving average of 100.
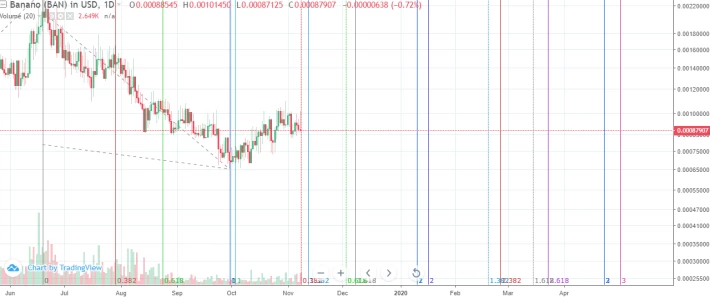
Applying the time pivots we have confidence for tomorrow (09/11) and between December 03 and 08 but would require a more detailed analysis of the short term to determine what kind of movement the chart could do now. In addition we have very interesting confuences on January 11 and April 23, in the next image explain how I think the price will behave from here until these dates.
Remember, time is a key element in graphical analysis since the graph is price x time, here I am applying a specific method that I developed to analyze how time pivots can interact with the graph.
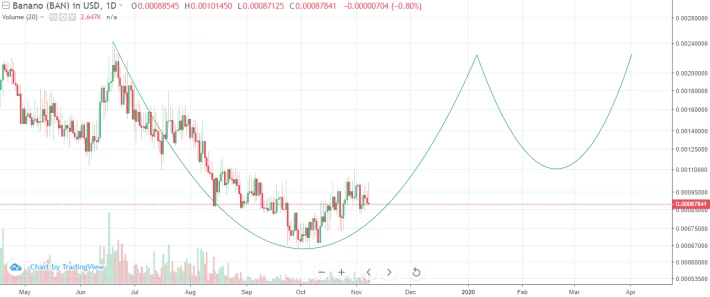
We may now be seeing a cup forming, from top to bottom we have 103 days so, in theory we would have to wait the same amount of days to form the next top of the cup, leaving us with a top close to the one previously seen ($ 0 , 0023) on January 11 (matches the analysis of the time pivots seen above). After that we would have to wait for the formation of the handle and breaking that top left near $ 0.0023 would see a new top forming at $ 0.0044.
Conclusion
The banano seems to have reached its bottom and is trying to recover, although it has found quite strong resistance in the 100-period moving average and at 0.786 fibonacci when / if this value breaks we can see the price returning to its glory time. The project itself is very interesting, both by technology and meme, and the constant team updates keeping the community always participatory is something different that makes a difference in a macro context. Some points that may push up the price of a banano would be listing on larger exchanges and a more trader community.
Thank you for reading :D






