Let's talk crypto trading. There's no magic formula here, so your number one job is to protect your cash. When you're in the market, you're hunting for the best odds you can find. That's where confluence comes in. Confluence is when several technical indicators all point to the same conclusion, whether to buy or sell. It's like having multiple weather forecasts all predicting rain, you're probably gonna want that umbrella.
Let's look at real-world examples:
- Support/Resistance: Imagine the price bounces off a key support level, lines up with an upward trend, and you see a bullish moving average crossover. That's a pretty strong signal right there.
- Indicators: Picture a Golden Cross (that's when short-term and long-term moving averages cross) happening at the same time as a positive divergence in the RSI. Another good sign to keep an eye on.
- Chart Patterns: You spot a bullish flag pattern forming at a key support level, and trading volume is picking up. This could mean the bulls are getting ready to charge.
When you've got multiple indicators all humming the same tune, your chances of making a good trade go up. It's like having several expert opinions all agreeing you got a solid trade. Waiting for these signals to line up helps you avoid jumping into trades based on flimsy evidence. Plus, it can help you nail down better entry and exit points. However, always use a stop-loss, no matter how good the signals look. It's your safety net in this unpredictable market. Patience is crucial. The pros develop a system, a set of rules they stick to religiously. It helps them spot good trades and keeps emotions out of the equation. Everyone's system is different, like a trading fingerprint. Now, I'm going to share a system with you, but don't think of it as the be-all and end-all. As you get more experience under your belt, you'll likely change it up. You might start looking at different candlestick patterns, play with timeframes, or try out new oscillators. Personally, I've even moved on to using custom scripts that combine multiple indicators to make spotting confluence easier.
Preparation
Technical analysis platform: TradingView
Trading platform: BloFin or Weex (no KYC)
Indicators: Fibonacci Retracements, Trendlines, EMA (3,9,21), Stochastic RSI, Volume
Timeframe: 4H
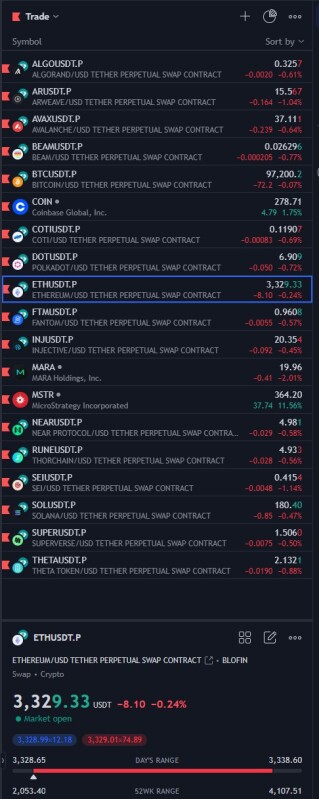
Step 1: Create a Token Watchlist in TradingView
Objective: Focus on the top-performing tokens to narrow down trading opportunities.
Action:
1. Open TradingView and create a new watchlist.
2. Add the top 100, 200, or 300 tokens by market cap. You can find these lists on websites like CoinGecko, CoinMarketCap, or directly from your trading platforms (BloFin or Weex).
3. Save this watchlist for easy access to analyze multiple tokens quickly.
Step 2: Identify Oversold Tokens Using Stochastic RSI
Objective: Filter for tokens that are oversold across multiple timeframes.
Action:
1. Open the Stochastic RSI indicator on TradingView.
2. Check the token's 12-hour, 8-hour, and 4-hour timeframes.
3. Look for tokens where the Stochastic RSI is below 20 on all three timeframes (indicating oversold conditions).
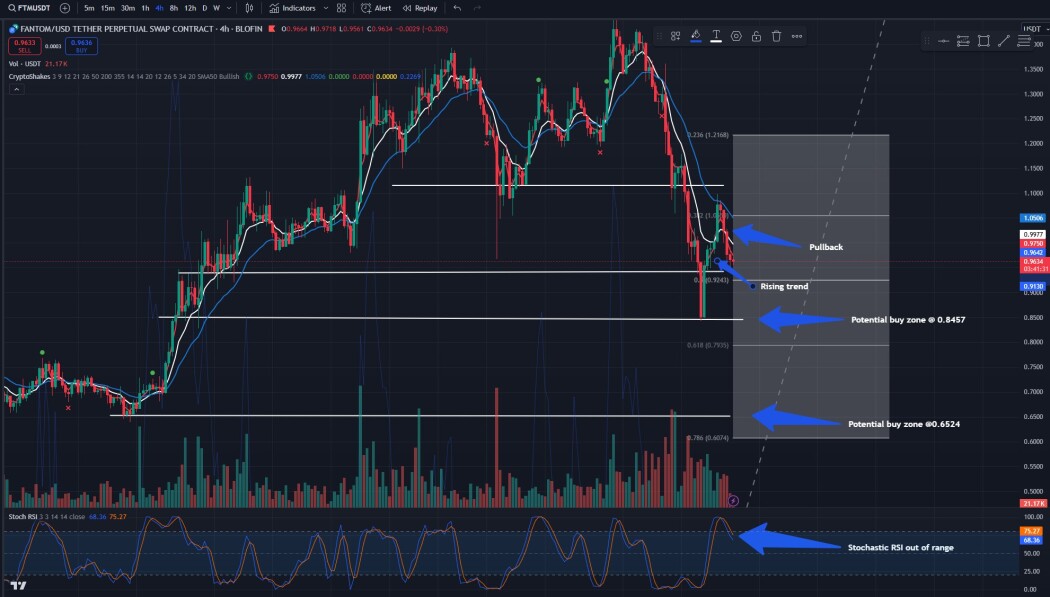
Step 3: Look for a Pullback After a Rising Trend
Objective: Identify a pullback in an uptrend to prepare for a potential buy.
Action:
1. Examine the token's price chart across the 12-hour, 8-hour, and 4-hour timeframes.
2. Confirm that the token was in an uptrend (higher highs and higher lows).
3. Look for at least 3 red closing candles in a row or a bearish candlestick pattern (e.g., evening star, bearish engulfing).
4. Observe the 3, 9, and 21 EMAs:
a. Ensure that the 3 EMA is above the 9 EMA, and the 9 EMA is above the 21 EMA (a bullish alignment) during the uptrend.
b. A pullback might cause the 3 EMA to start crossing below the 9 EMA, indicating a temporary correction.
5. Check for declining volume during the pullback:
a. A pullback with lower volume suggests a healthy correction in the uptrend, increasing the probability of a reversal.
Step 4: Chart Horizontal and Diagonal Trendlines
Objective: Identify key support and resistance levels to guide your entry and exit points.
Action:
1. Draw horizontal trendlines at significant price levels where the token reversed or consolidated in the past.
2. Draw diagonal trendlines by connecting the lows of the uptrend (support) or the highs of a downtrend (resistance).
3. Use these trendlines on the 12-hour, 8-hour, and 4-hour timeframes for confirmation.
4. Note if the price is pulling back toward the 21 EMA, as this level often acts as dynamic support.
5. Check for volume spikes near trendline support:
a. A sudden increase in volume at a support level can indicate strong buying pressure.
Step 5: Use Fibonacci Retracement to Find Entry Levels
Objective: Identify potential buy zones during the pullback.
Action:
1. Select the Fibonacci retracement tool in TradingView.
2. Measure the retracement by drawing from the bottom (start) of the last upward trend to its top (apex).
3. Focus on the 0.618 and 0.786 Fibonacci levels as potential entry points.
4. Look for the 21 EMA to align with or be close to the Fibonacci levels, as this adds confluence to the trade.
5. Check for increasing volume as the price approaches a Fibonacci level:
a. A rise in volume near the 0.618 or 0.786 Fibonacci level suggests buyers are entering the market.
Step 6: Place Limit Orders Slightly Above Fibonacci Levels
Objective: Strategically place buy orders near support levels to maximize your entry efficiency.
Action:
1. Place limit buy orders slightly above the 0.618 and 0.786 Fibonacci retracement levels.
2. Ensure your entry aligns with a horizontal support line or the 21 EMA for added confirmation.
3. Risk Management:
a. Never risk more than 2% of your total account per trade.
b. Divide the 2% risk between the two limit orders. For example, if your account is $1,000, each order would use a maximum of $10.
Step 7: Wait for the Trade to Play Out
Objective: Allow the trade to reach its potential without overreacting to short-term price movements.
Action:
1. Be patient! On the 4-hour timeframe, trades typically take 3–5 days to complete.
2. Avoid micromanaging the trade or changing your plan based on minor fluctuations.
3. Monitor the 3, 9, and 21 EMAs:
a. If the 3 EMA begins to cross back above the 9 EMA, it could signal the start of a reversal.
4. Confirm the reversal with increased volume:
a. A spike in volume during the reversal phase (e.g., 3 green candles) adds confidence that the trend is resuming.
Note: For faster trades (e.g., day trading), magically become an experienced expert or look elsewhere.
Step 8: Identify the Reversal and Use Fibonacci to Find Profit Levels
Objective: Determine when to sell for maximum profit.
Action:
1. Watch for the downward trend (pullback) to reverse:
a. Look for at least 3 green closing candles in a row or a bullish candlestick pattern (e.g., morning star, bullish engulfing).
b. Confirm that the 3 EMA is crossing above the 9 EMA, and the 9 EMA is above the 21 EMA (a bullish alignment).
2. Use the Fibonacci retracement tool again, but this time measure from the top (start) of the downward trend to its base (end).
3. Focus on the 0.618 and 0.786 Fibonacci levels as potential sell zones.
4. Check for declining volume as the price approaches the 0.618 or 0.786 Fibonacci levels:
a. Declining volume during an upward reversal may signal that buyers are losing momentum, making it a good zone to take profit.
Step 9: Set Limit Sell Orders to Take Profit
Objective: Exit the trade at predetermined levels to secure profits.
Action:
1. Place limit sell orders near the 0.618 and 0.786 Fibonacci levels.
2. Alternatively, monitor the Stochastic RSI:
a. If it moves into the 80–100 range (overbought), consider selling to lock in profits.
3. Confirm your sell decision with volume analysis:
a. If volume begins to spike near the 0.618 or 0.786 Fibonacci levels, it could indicate increased selling pressure.
Risk Management and Final Notes
--Position Sizing: Always ensure that your total position size per trade does not exceed 2% of your account balance.
--Stop Loss: Consider placing a stop loss below the 0.786 Fibonacci level to minimize potential losses.
--Patience: Stick to your plan and avoid emotional trading decisions.
--EMA & Volume Confirmation:
a. Ensure the 3 EMA is crossing above the 9 EMA during the reversal phase, with the 21 EMA acting as support.
b. Use volume spikes as confirmation for both entries and exits.