
Greetings! In this article, I will go over my technical analysis I did today and explain what indicators were notable and future potential scenarios of the BTC price action.
Retracement Imminent?
During the past couple of days, Bitcoin has been trading in between the range (33k-34.8k). However, despite Bitcoin trading within a sideways range, it is still due for a strong retracement. Depending on where the retracement goes down to will determine whether or not in the long term Bitcoin will continue going up or down.
4-hour time frame
In the 4-hour time frame, the RSI is touching near overbought territories. The MACD, however, is formulating a bullish cross. However, due to the daily time frame, it is likely that the bullish cross would most likely not be formed. The MACD would most likely either go into a neutral range or take another dip after a slight pump. Overall, the 4-hour time frame is slightly bearish due to the RSI nearing overbought territories.
24-hour time frame
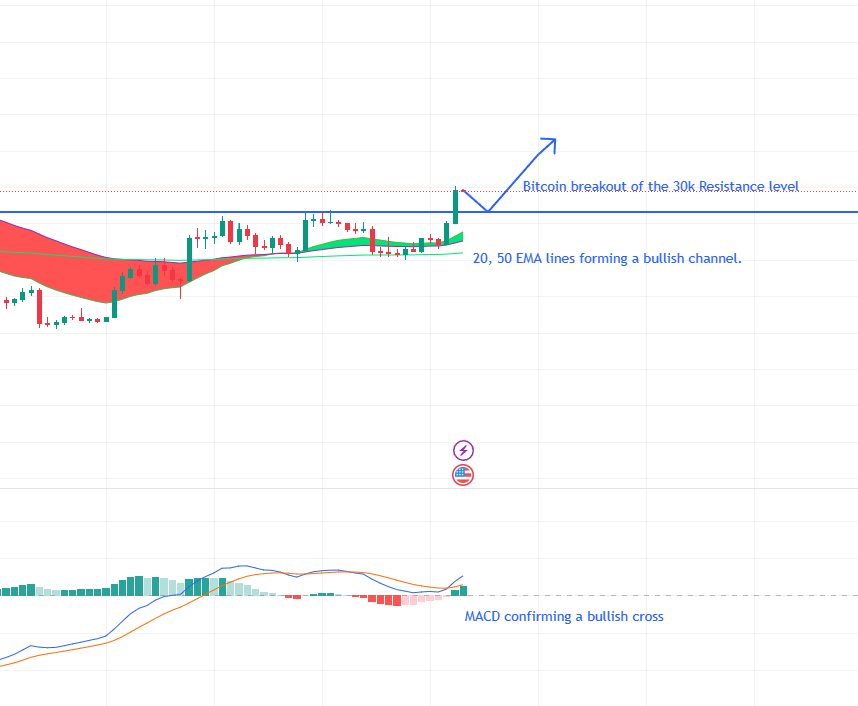
In the daily time frame, the RSI is still within the higher region of the overbought territories. Furthermore, the MACD is finally curving to form a bearish cross (With a long of significant momentum along with it). This means that when the bearish cross is confirmed, Bitcoin will either find retracement in the 31k levels or the 30k levels. However, both levels are relatively bullish because both still form higher lows at the end. Additionally, Bitcoin has formed a strong bullish channel with the 20 and 50 EMA levels (Which will act as bottom line support for a bullish divergence). Overall, the daily time frame looks relatively bearish for the time being due to the overbought nature of both the MACD and RSI, however, as long as Bitcoin can find support along 30k or 31k, the bullish divergence will continue on.
Weekly time frame
In the weekly time frame, the RSI is touching the lower regions of the overbought territories. The MACD has formed a bullish cross and is beginning to print strong green bars. Despite the MACD, however, the RSI shown on the weekly time frame does hint of a strong retracement (Supported already by the 24, and 4 hour time frames previously). However, like the 24-hour time frame, Bitcoin has formed a bullish channel with the weekly 20 and 50 EMA lines (Which could act as bottom line support for a bullish divergence/trend).
Conclusion:
In conclusion, the 4-hour, 24-hour, and weekly timeframes all indicate that a retracement is soon to come. However, depending on whether the retracement goes to the 31-30k levels or not will determine whether this breakout to 34k was a fakeout or not.


