
Greetings! In this article, I will go over my technical analysis I did today and explain what indicators were notable and future potential scenarios of the BTC price action.
Bitcoin To 36k Soon?
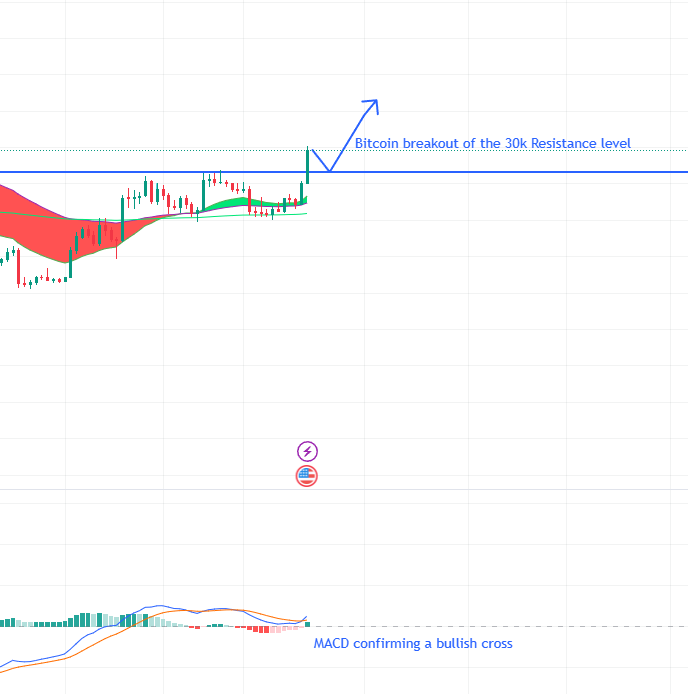
Today, Bitcoin rallied 13% towards 34.6k. This has been the largest move in any direction in the past couple of months. Currently, Bitcoin managed to breakout of the 30k level of resistance, which means quite a bit on the technical aspect of Bitcoin. Today, I will be going over the potential outcomes of Bitcoin and the future implications of this rally.
4-hour time frame:
In the 4-hour time frame, Bitcoin is currently well into overbought territory (With it being at a whopping 91 RSI). The MACD is also well into overbought territory as well. These two indicators indicate that within the next few days, a correction is bound to happen. At this point, both the RSI and MACD have reached nearly the highest level in the overbought territory, which means that the higher the price rallies, the higher likelihood of a correction increases as a result.
24-hour time frame:
In the 24-hour time frame, there is a similar situation with both the RSI and MACD as on the 4-hour time frame. The RSI is at 88 (Which is very overbought) and the MACD is also at unhealthy levels of overbought territory. However, if a correction is to occur, Bitcoin still has a variety of support levels. These include the 30k, 28k, and the 20, 50, and 200 EMA (Of which, the 20 and 50 EMA are forming a strong bullish channel). Nonetheless, the unhealthy MACD and RSI is definitely a cause of concern when it comes to shorter term price action. However, if the correction manages to find support preferably at the 30k support region, it would confirm a higher low in the overall macro trend along with a confirmed region of support.
Weekly time frame:
In the weekly time frame, the RSI is touching overbought territories and it is officially out of RSI resistance. The MACD looks very bullish, with it finally forming a bullish channel and it printing its first strong-green bar. Furthermore, Bitcoin is also well-above the 200, 20, and 50 EMA regions (With the 20 EMA and 50 EMA forming a bullish channel). However, despite the weekly time frame being bullish in the longer term, like the 4 and 24 hour time frames, the weekly RSI also displays the strong possibility of a correction within the near future.
Conclusion:
In conclusion, Bitcoin is set for an overall uptrend in the longer term (To 36k+), however in the short term, it is likely that a correction is bound to happen (Most likely at 30k).


