
Greetings! In this article, I will go over my technical analysis I did today and explain what indicators were notable and future potential scenarios of the BTC price action.
Accumulation Zone Coming Soon?
For the past couple of weeks, Bitcoin, and other cryptos, have been on a constant downward trajectory. However, further technical analysis shows that there is a possibility that Bitcoin might hit very low price targets (22k-20k) in the future.
4-hour time frame:
In the 4-hour time frame, both the RSI and MACD are recovering from recently oversold territories. The MACD formed a bullish cross and is currently riding it out and the RSI is back into neutral territories. This indicates that within the next few days or so, we can be seeing price targets such as 27.3k-27.5k levels of resistance. However, despite the 4-hour time frame being bullish, it is still important to look into the daily time frame to get a clearer view of the overall price action.
24-hour time frame:
In the 24-hour time frame, the RSI is within neutral territories. Additionally, the MACD is currently still in a bearish move. Despite this, the MACD currently is curving, which indicates that within the next week or so, Bitcoin could be forming a higher high (Since it confirmed a higher low). However, Bitcoin was recently rejected from the 200 EMA resistance level, which indicates that Bitcoin is lacking enough bullish momentum to carry out a higher high.
Weekly time frame:
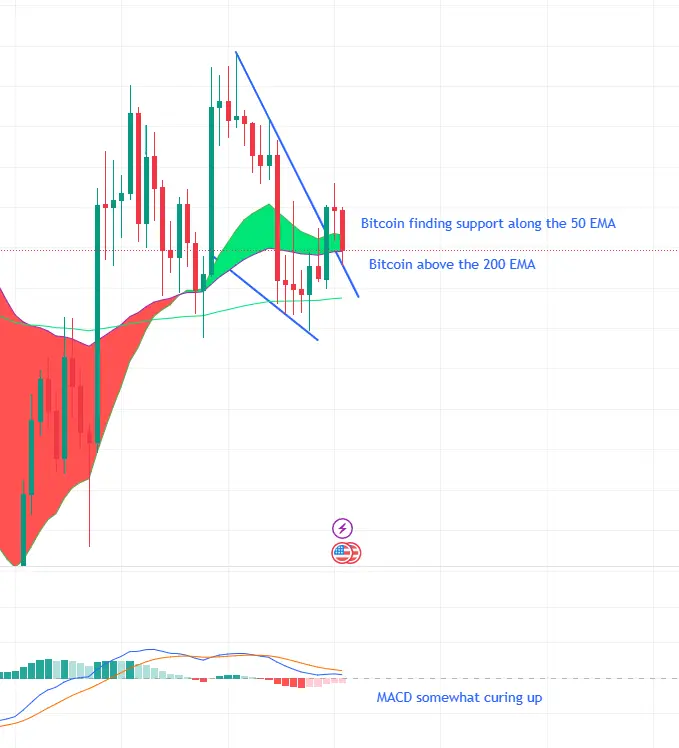
In the weekly time frame, the RSI is within neutral territories, but is still under strong resistance. The MACD has been also curving slightly up (With weaker red bars being printed) which means that bearish momentum is slowing down. Additionally, Bitcoin is still well-over the 200 EMA and formed support on the 50 EMA as well. While these indicators seem bullish, without any bullish momentum from any kind of catalyst, it is likely that Bitcoin will remain either neutral, or touch lower price targets within the near future (For a temporary amount of time). If Bitcoin is to return within the descending wedge pattern, it is definitely possible that Bitcoin would reach targets such as 24.5k or even 23k-22k.
Conclusion
While there is a chance for Bitcoin to make and confirm a higher high, the RSI and the 20 EMA of the weekly timeframe makes it very difficult for Bitcoin to seek higher price targets. Due to this, Bitcoin is likely to return within the descending wedge to potentially 22-23k (Other macroeconomic factors could also bring the price downwards as well) within the near future for a temporary amount of time. However, I believe that if this is to happen, it would be a prime time to accumulate before any kind of bullish catalyst (Such as the ETFs and halving) comes along.





