
Stellar (XLM) is undergoing a correction after its explosive rally in July. A weekly doji candle suggests a potential trend reversal. The initial spike was fueled by PayPal news, but now attention turns to key support levels at $0.3980 and $0.3600 USDT.
Stellar Corrects After July Rally
The broader crypto market correction over the past 48 hours has also affected Stellar. After a strong upward move in the first three weeks of July, XLM is now experiencing a clear price cooldown.
On a weekly basis, $XLM is down −9.20%, following a minor −1.70% drop the previous week, during which it reached a yearly high of $0.5265. As of writing, Stellar is trading at $0.4190, with a +1.24% daily move. Despite this pullback, the 2025 year-to-date performance remains positive at +29.35%.
PayPal Behind Stellar’s July Boom
Stellar's July rally was largely driven by a massive +87.74% surge in the first week, sparked by key announcements regarding its ongoing collaboration with PayPal. This news attracted significant investor attention, driving market momentum.
As a result, Stellar’s market capitalization soared to $13.36 billion, briefly pushing it to 12th place in the global crypto ranking.
Weekly Chart Overview: Breakouts and Reversals
Looking at the weekly chart over the past 10 months, Stellar broke out in November 2024 from a long-term consolidation phase that had persisted since July 2022. This breakout triggered a strong upward move, closing the month with a +173% gain, and reaching a period high of $0.6389 USDT — a level not seen since May 2021.
2025 Crash into April
In early 2025, Stellar entered a correction phase, breaking below support at $0.3550 USDT in late January, and continuing downward to mark an annual low at $0.2000 USDT in April.
From that point, a multi-swing rebound began, peaking in May at $0.3344, before another drop to the June low of $0.2167 USDT.
Key Breakout and Signs of Reversal
The rebound from June led to a breakout of the main descending resistance, drawn from the November 2024 high to the April 2025 low, around $0.42 USDT.
Last week, XLM reached a high of $0.5206, nearing the target resistance at $0.5480 USDT, but failed to break through. The weekly candle formed was a doji with long upper and lower shadows, appearing above the upper Bollinger band — a classic technical reversal signal.
This week’s ongoing decline seems to confirm the start of a corrective phase.
Reversal Doji and Key Support Levels
Currently, the primary price movement to observe is the vector from April's low to last week’s high. Within this structure, two key support levels stand out:
-
First support: around $0.3980 USDT
-
Deeper support: near $0.3600 USDT
A drop below these levels could signal further bearish pressure.
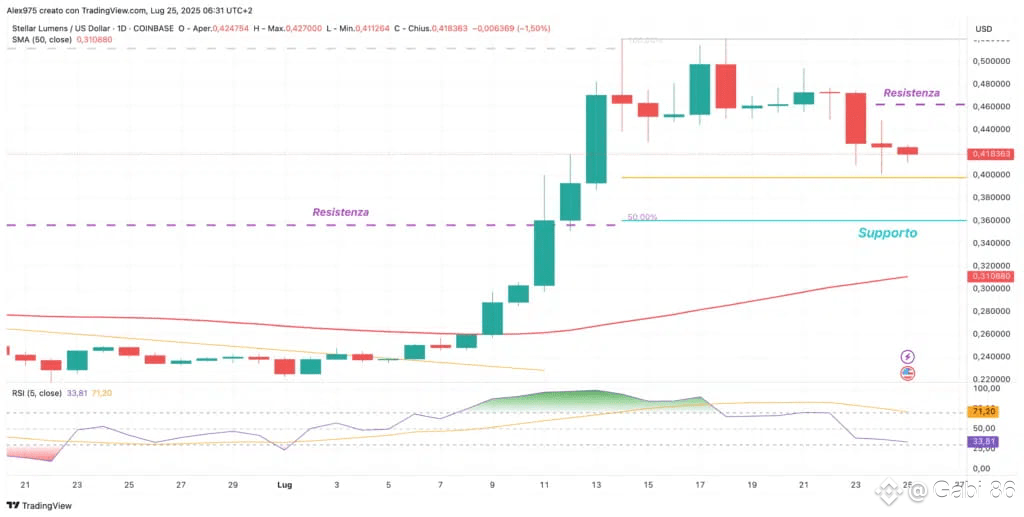
On the daily chart, we can see that yesterday, Stellar's price approached the first key support level. The RSI indicator had already signaled weakening momentum a week ago, when it exited the overbought zone.
In this context, the $0.36 USDT support zone becomes crucial. A break below this level could pave the way for a deeper correction, potentially pushing the price down toward the 50-day Simple Moving Average (SMA50).
For a bullish reversal and renewed upward momentum, Stellar needs to close above the $0.46 USDT area.


