
The last 24 hours in the crypto and financial markets have revolved around the failure of talks between Iran and the USA and the relative implications for the reopening of the Strait of Hormuz. Oil has returned to an upward trend, with WTI trading at 104.10 dollars and Brent at 102.20 dollars. Cryptocurrencies are down, with Bitcoin recording a -3.16% drop yesterday and Ethereum -4.08%.
Bitcoin and crypto already facing oil above 100 dollars
The standoff between the United States and Iran remains at a deadlock following the failure of negotiations that lasted 21 hours and ended without an agreement. However, the two-week truce remains active, and the Strait of Hormuz continues to be traversed by some tankers and cargo ships.
President Trump has announced a possible naval blockade of the strait, with the aim of striking Iranian exports. The US Navy could stop all vessels, creating a restricted zone. This scenario would increase volatility in oil. Today, overnight futures openings are down, with the Nasdaq at -0.86%, the S&P 500 at -0.67%, and in Europe, the DAX is recording a -1.46%.
Everything revolves around Hormuz and oil
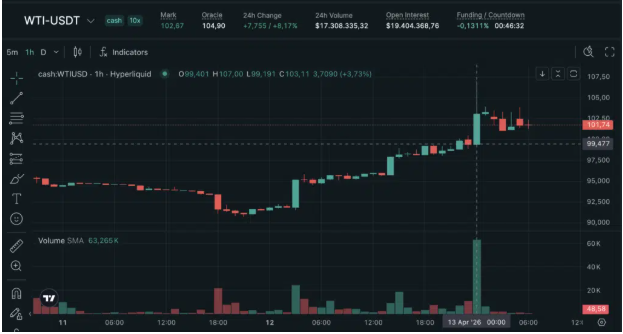
Attached is the chart of oil price movements tracked on the Hyperliquid platform, used during the weekend when the official CME futures market is closed. It shows a declining phase on Saturday during the talks, followed by a bullish acceleration in the early hours of last night upon the announcement of the failed negotiations, with oil increasing from 91 to a peak of 107 USDT tonight.
Performance of the Top 20 Cryptos in April The crypto market obviously reacted with a decline yesterday, featuring a bearish spike that has not yet been absorbed. However, following the impact of the bad news, the market has begun to move into a sideways phase.
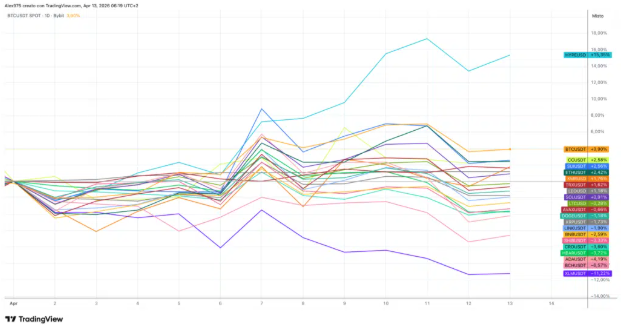
Since the beginning of April, the majority of tokens remain in positive territory, although there have been numerous shifts into the negative. The worst performer is Stellar at -11.28%, followed by Bitcoin Cash at -6.50%. The token with the highest gain remains Zcash at +44%, which was not included in the chart as it would overly compress the scale. This is followed by Bitcoin's rise of +3.92%, while Ethereum's monthly increase is limited to +2.40%.
Bitcoin Short-Term Scenario BTC is currently trading at 71,045 USDT and, at the time of writing, is up +0.40%. On the daily chart, we have mapped the trend from the high recorded in March at 76,030 USDT to the relative downward phase reaching the low of 64,978 USDT, from which the current April leg up originated.
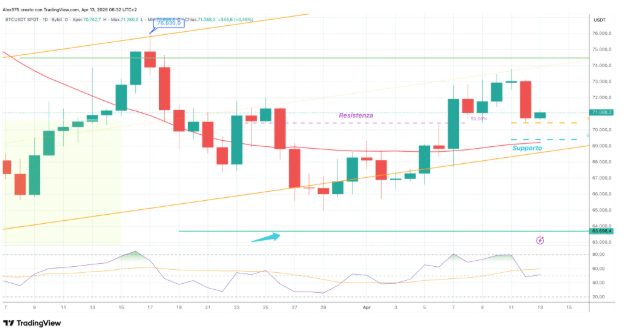
Bitcoin (BTCUSDT) – daily 13 april 2026
In this movement, Bitcoin is recording a series of higher highs and higher lows and has approached the 74,500 USDT resistance, which had rejected the price of BTC back in March. Two days ago, it formed a Doji candle—typical of market uncertainty—and indeed, a contraction phase occurred yesterday.
During the decline, BTC leaned on the first short-term vector support at 70,400 USDT, relative to the movement from the March low to the high of 73,800 USDT. The main support, however, is located in the 69,390 USDT area, where it also intersects with the 50-day moving average (SMA 50).
Short-Term Scenario for Ethereum
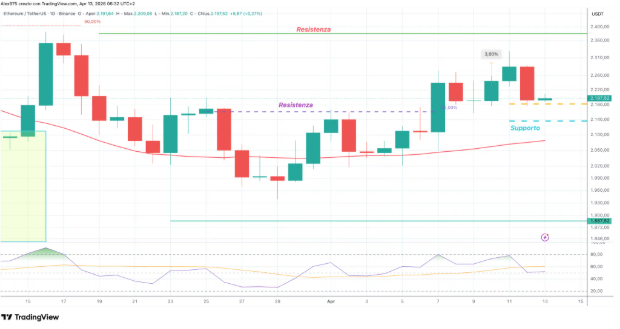
Ethereum (ETH) presents a similar graphical situation, currently trading at 2,197 USDT. The chart provides an overview starting from the March high, when it touched the vector resistance of 2,380 USDT; from that point, a relative price contraction phase began, reaching the late March low of 1,938 USDT. This triggered the leg up that led to Saturday's high of 2,330 USDT, where ETH stalled and subsequently retraced by -4% yesterday.
Currently, ETH is resting on the first short-term support in the 2,180 USDT area, which corresponds to the 38.2% Fibonacci retracement of the vector spanning from the March low to the April high. The main support, however, is located in the 2,135 USDT area, while the SMA 50 sits further below.


