
Among cryptocurrencies, Monero (XMR) stands out negatively, suddenly turning red in an otherwise positive August for the vast majority of the market. The decline is linked to a suspected 51% attack on its hashrate.
Monero Attack: Hypotheses and Uncertainties
The situation is still unclear. Some accuse the company Qubic, led by Sergey Ivancheglo, of a publicity stunt, but it seems that something did actually happen on the blockchain.
This has caused Monero’s price to drop, closing yesterday at -5.32% and marking the fourth consecutive day of decline. In reality, the downward trend has been underway for several weeks and is not entirely unexpected.
Weekly Overview of Monero

Currently, Monero has a market capitalization of $4.625 billion and ranks 31st on CoinMarketCap. It has been listed in the crypto market since 2014.
On the weekly chart, we can observe XMR’s price from the beginning of 2024, showing part of the congestion that began in July 2022. This congestion lasted throughout 2024, with the price repeatedly halting at the $177 resistance area.
Breakout in December 2024 and Rise in 2025
A breakout occurred in December 2024, with a weekly bullish candle of +37%, starting an upward phase that brought XMR to a high of $420.19 in May 2025. This rise included a sequence of seven consecutive green weekly candles.
From May onwards, a bearish phase began, finding initial support around $300. After a brief reaction at this level, the price resumed its downward movement, breaking the main support at $260. This level corresponds to the 50% Fibonacci retracement from the February 2024 low of $100.27 to the May 2025 high of $420.
Breaking this vector level puts Monero out of the main uptrend that had characterized its performance over the past eight months. In this scenario, a further drop toward the $197–$200 static area is possible, with the next vector support around $170.
Short-Term Monero Scenario
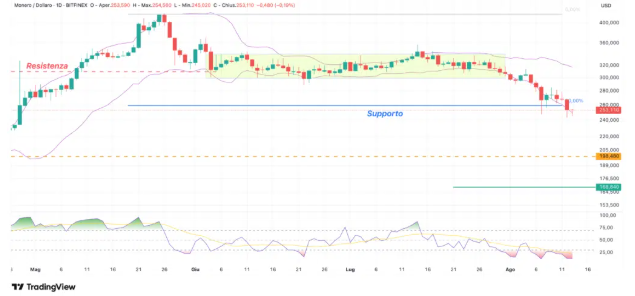
The daily chart shows the movement from the May high and the subsequent downtrend. There was a lateral phase between May and June, followed by the breakdown starting in early August.
Currently, $XMR is below the medium-term support at $260. RSI analysis shows weakness and oversold conditions. Regarding Bollinger Bands, there is no clear oversold signal, with candles fully outside the lower band.
What to Watch on XMR
For potential entries, it is necessary to wait for chart patterns indicating possible reversal signals for Monero. This is within a context of uncertainty linked to the alleged Qubic attack; any denials could trigger rapid price squeezes.


