
Ethereum (ETH) nearly touched 4,000 USDT, reaching a high of 3,941 USDT before entering a slight pullback phase. At the time of writing, it is trading at 3,760 USDT, marking a 3.65% retracement from its 24-hour high. July is shaping up to close for ETH with a +52.20% gain.
Ethereum Nears 4,000 USDT
The ongoing rally for Ethereum began from the yearly low recorded in April, at $1,385. In just 110 days, the price has surged by +172%. This momentum positions Ethereum as the best-performing token within the Top 20 in terms of growth during the rebound of the last three months since the April low.

Altseason and Ethereum
In the attached chart overview, it is clearly visible how Ethereum ranks among the top performers. Leading the list is Hyperliquid with a +268% gain, followed by Ethereum and a series of other mid-to-large-cap altcoins.
In recent weeks, attention has intensified on what could shape up to be a new Altseason, marked by a strong expansion in the altcoin sector.
Market Cap Comparison: Ethereum, Bitcoin, and Altcoins
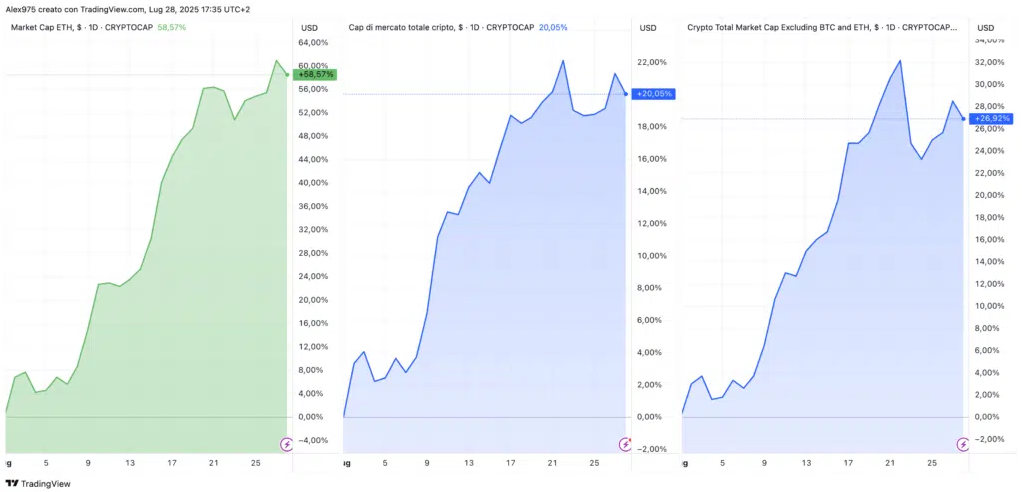
Ethereum Weekly Overview
In the attached chart, we can see Ethereum’s market cap trend since the beginning of July, compared to Bitcoin and TOTAL3 — which represents the total crypto market capitalization excluding BTC and ETH.
In this scenario, where the total crypto market cap has reached a new all-time high of 4 trillion USDT (as detailed in an article by editor Alessio Ippolito), the main driver of this growth has been Ethereum, with a +57.60% increase since early July — far outperforming Bitcoin’s +19.77%. TOTAL3 has also posted a solid +26.65%, signaling growing interest in the altcoin sector.
These figures suggest a gradual capital rotation from Bitcoin to Ethereum and subsequently to the rest of the altcoins — a typical pattern observed in the early stages of a potential altseason.

Ethereum Weekly Chart Overview
The weekly chart of Ethereum is now familiar to many traders, who could almost recall its candlestick pattern by heart. The overview starts from the December 2024 high at $4,108, followed by a sharp downtrend that bottomed in April 2025 at $1,385. From that level, the ongoing rally began.
Over the next three months, Ethereum went through a challenging consolidation phase, capped below the key resistance at $2,720 — a decisive pivot level until just three weeks ago, when a major breakout occurred. From there, ETH entered a new leg up, culminating yesterday with a high of $3,940.
ETH Price Targets
The current technical setup now points towards a test of the December high at $4,108. A breakout above this level could pave the way for a potential continuation of the bullish trend, with the next target set at the all-time high of November 2021.
Daily Network Activity on Ethereum
Daily on-chain activity on Ethereum has shown a marked increase over the past weeks, in line with the recent price surge. Transaction volumes, active addresses, and DeFi protocol usage have all grown, indicating renewed investor engagement and network demand. This uptick in activity often supports bullish price momentum, as it reflects both speculative interest and genuine utility growth across the Ethereum ecosystem.
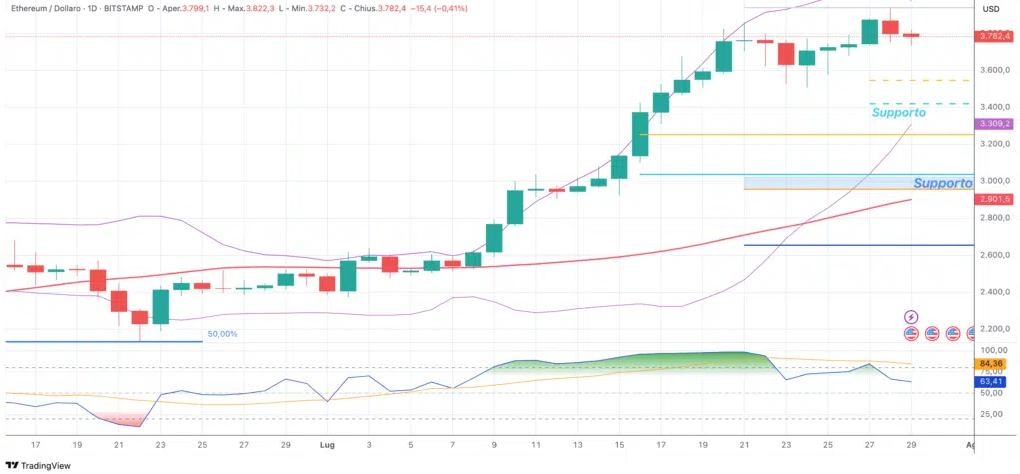
Ethereum Daily Chart Analysis
In the daily chart, yesterday’s negative close stands out, accompanied by a potential short-term warning signal. This is highlighted by the RSI, which has remained below the peaks reached roughly ten days ago, showing a clear divergence.
Such RSI behavior serves as a cautionary sign of possible momentum loss and could precede a corrective phase. However, it will be necessary to wait for potential price confirmations before considering bearish signals as active.
In this context, the first short-term support level is located at 3,550 USDT, while the more significant support lies in the 3,420 USDT area.


