
Among the long-standing crypto market tokens that initially showed signs of a possible recovery in July is Cosmos (ATOM). It is currently trading at $4.15 USDT and, in the first days of August, is down 1.30%.
A Recovery That Never Materialized
July did post a higher low of $4.007 USDT compared to previous months — June and the annual low of $3.386 USDT in March.
ATOM Among 2025’s Underperformers
Despite some recovery signals, ATOM is still down 32.86% year-to-date. This negative performance is in line with other Top 20 tokens such as Polkadot, Avalanche, and Dogecoin, which have all dropped between 42% and 50% since January. At its current value, Cosmos has a market cap of $1.62 billion and ranks 55th.
July was noteworthy for Cosmos thanks to the IBC v4 upgrade, which improved cross-chain interoperability and brought monthly transactions to $1.2 billion. The “Eureka” update strengthened connections with Ethereum. These updates, rolled out on July 2 and 17, improved scalability and allowed the network to reach over 100 active chains.
Cosmos Price Action on the Weekly Chart Since 2024

ATOM is one of the crypto market’s veteran tokens, having been listed on exchanges since 2019. Its all-time high (ATH) of $44.45 USDT was reached in January 2022, followed by a long and intense downtrend.
On the weekly chart, the last significant high was recorded in March 2024 at $14.56 USDT. From there, a downward phase began, hitting a low in September at $3.61 USDT. This was followed by a rebound to $10.67 USDT in December — still below March’s peak.
The 2025 Recovery Attempt
The downtrend continued into 2025. In March, Cosmos hit its annual low of $3.38 USDT. From that level, a rebound began, reaching a May high of $5.49 USDT but failing to break the first technical resistance at $6.14 USDT.
Short-Term Scenario for ATOM
On the daily chart, starting from June’s low of $3.55 USDT, ATOM began a rebound that broke through resistance at $4.52 and reached a July high of $5.31 USDT.
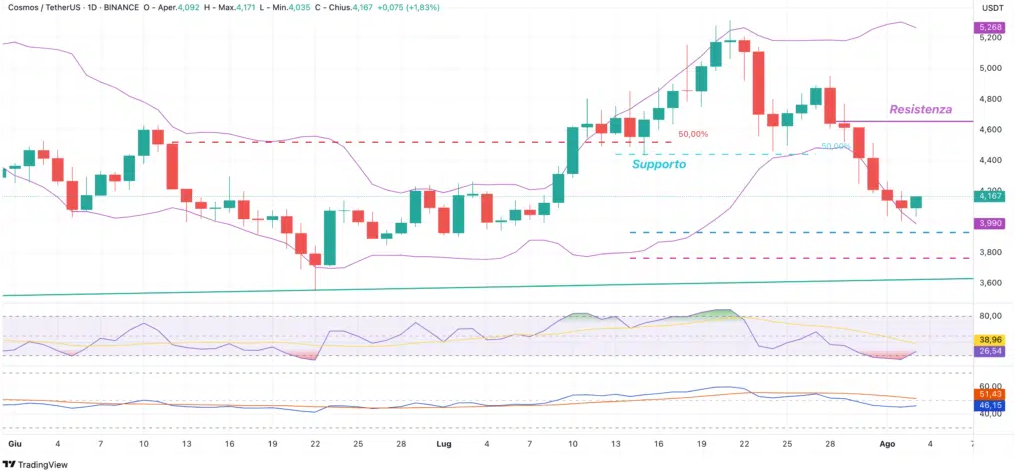
From there, a Doji candle formed, triggering a downward move that fell to the first support at $4.44 USDT. A brief reaction followed, but by late July, that support was broken to the downside.
Support, Rebound, and Resistance
Yesterday, ATOM hit a low of $4.07 without testing the $3.92 USDT support. The move did not produce any usable pattern, as the price remained within the lower Bollinger Band.
At the time of writing, ATOM is up 1.69%, but to signal a true recovery, it must break the first resistance at $4.65. From an indicator perspective, the fast RSI is turning upward and exiting oversold territory, but confirmation will require the daily candle to close above this level.


