
The altcoin markets have been surging recently, as cryptocurrencies such as XRP and ETH surge by over 20%. Furthermore, XLM has increased by over 30% in today’s trading session alone! These price increases have many suggesting that Altseason is about to kick-off once again.
But as these altcoins start to rocket, what will happen to Bitcoin?
Bitcoin has been trading within a period of consolidation since mid-June and has been trading within the confines of a descending triangle (yes it is descending and not symmetrical!). The cryptocurrency has been very stable over the past week moving by a positive small 1.26%. However, if Bitcoin continues to grind lower and falls beneath the lower boundary of the triangle, we may see a correction toward the $6,100 level.
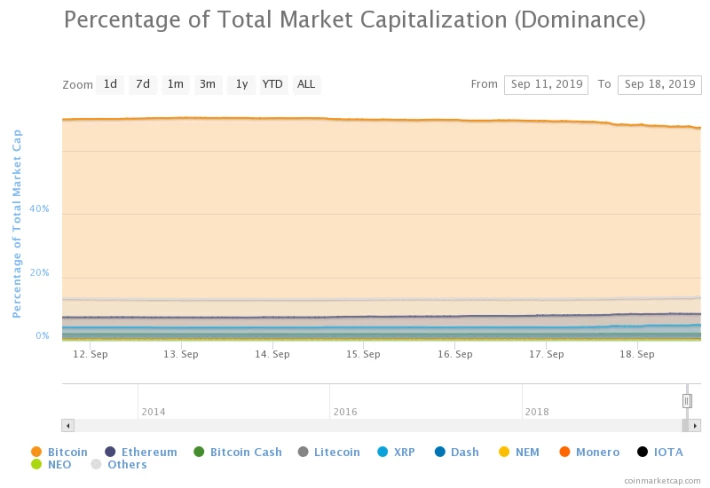
Bitcoin currently holds a $183 billion market cap value, but the dominance is starting to fall. BTC dominance was recently holding strong around the 69.5% level but has now started to show some signs of weakness as it drops to 67.3% today.
Personally, I would be happy seeing Bitcoin continue to trade sideways giving altcoins a chance to move higher, however, we all know that markets do not work on hope. Yesterday, I had written an article about the parabolic movements seen within the Hash Rate of BTC. The Hash Rate, or the mining confidence, has now reached ATHs as more and more miners start to become very confident in the future prospects of Bitcoin. If they were not confident, then they would not be adding resources into the Bitcoin network. But the real question is when Bitcoin stops consolidating - which direction will it break out?
Let us take a look at the charts!
Bitcoin Price Analysis
BTC/USD - MEDIUM TERM - DAILY CHART
What Has Been Going On?
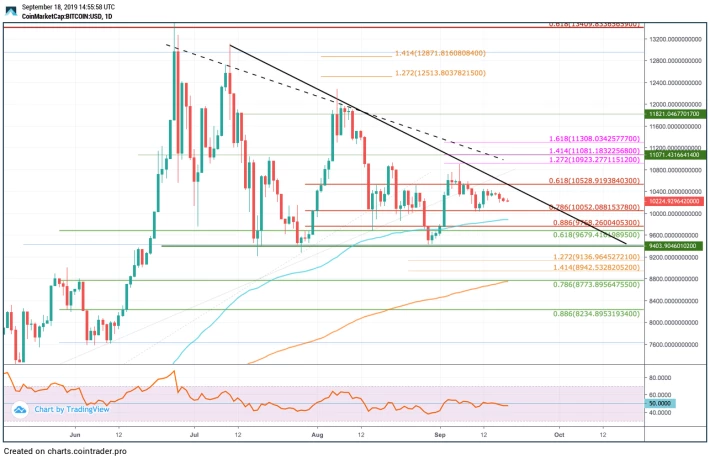
Bitcoin continues to trade sideways between the narrow September range between $10,528 and $10,052. The market has not been able to break above or below this level during September. Furthermore, the market is quickly approaching the apex of the descending triangle, at which point a breakout is expected. Typically, descending triangles will resolve themselves in the southward direction, meaning a break beneath the lower boundary at $9,400. However, if the miners’ confidence is at an all time high, this might provide enough positive sentiment to prevent a collapse beneath the triangle.
Where Can We Go From Here?
The RSI is trading directly along with the 50 level which shows major indecision within the market - and indication that this coin can head in any direction. If the slow bearish grind lower continues, we can expect immediate support to be located at $10,052 and at the $10,000 barrier. Beneath this, support is then expected at the 200-days EMA around $9,875, $9,768, $9,679, and the lower boundary of the triangle at $9,400.
If the selling continues to push BTC beneath the triangle, support is then expected at $9,136, $9,000, $8,942, and $8,773 (strengthen by the 200-days EMA). A breakdown of the triangle should allow the selling to continue until the pattern is complete around the $6,100 level.
Alternatively, if the bulls regroup and start to push the market higher, we can expect immediate resistance to be located at the upper boundary of the triangle, around the $10,528 level. Above this, higher resistance is then expected at $10,800, $10,923, $11,000, $11,081, and $11,308.
Conclusion
Can Bitcoin follow these Altcoin spikes? We do not really know just yet as the market players remain indecisive. Hopefully, Bitcoin can continue to trade within the consolidation pattern until it reaches the apex at some point during mid-October. During this sideways trading, it will allow for the Altcoin markets to catch up and see some positive increases which have been sorely missed!
Adios!






