
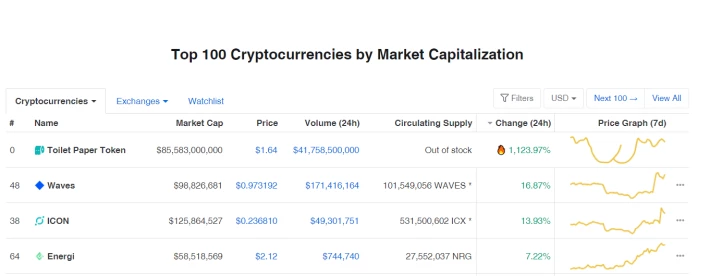
The Waves cryptocurrency is the top-performing asset today as it increases by a total of 16.87% over the past 24 hours of trading. The cryptocurrency had witnessed a surge from the $0.8 level and managed to rise above the $1.00 level before rolling over and falling back beneath here.
Well, actually, WAVES has actually been outperformed by a new kid on the block. Toilet Paper Token is taking the market by storm with a 1,124% price increase in the past 24 hours alone! In fact, it has been flying off of the shelves so quickly that the circulating supply is already out of stock! If you did not manage to stock up on toilet paper before this madness, you are already too late!
(P.S - don’t think I missed the ass on the price graph)
Back to being serious!
Waves is actually the top-performing cryptocurrency today as it increased by over 16.87%. Whilst the market continues to feel the setback caused by the Coronavirus pandemic, the Waves team continues to provide features and community resources that are helping to increase the price.
"What Was Recently Going at Waves Ecosystem"
Although developmental releases are pretty light, there are still lots of things that have been occurring within the Waves ecosystem over the past few months. Here is a quick breakdown of what has been going on.
1. Waves ReleaseCOVID-19 Prediction Market
As the number of Coronavirus cases continues to cripple the entire world the Waves team released a prediction market this week to predict if the number of weekly COVID-19 cases will peak by June 1st.
Through two tokens users can cast their prediction on if they think the number of COVID-19 cases will peak by June 1st. Depending on the outcome on June 1st, those who hold the winning token will receive a reward to the tune of 1 USDN for each winning token purchased.
The two tokens are COVID-DWN-JUN20 which wins if the total number of new confirmed cases during any week is less than during the previous one and COVID-UP-JIN20 which wins if the number of infection cases increases every week to June 1.
A data oracle is used to record the number of confirmed cases that are plugged into data provided by John Hopkins CSSE.
2. SignatureChain releases on Waves mainnet
Signature Chain is a dApp that is focusing on Blockchain Data Certification for digital content. Users can certificate their digital content such as documents, video, audio, and images and have them timestamped with a unique hash which will serve as a digital signature of the file and will be stored on the Waves Blockchain.
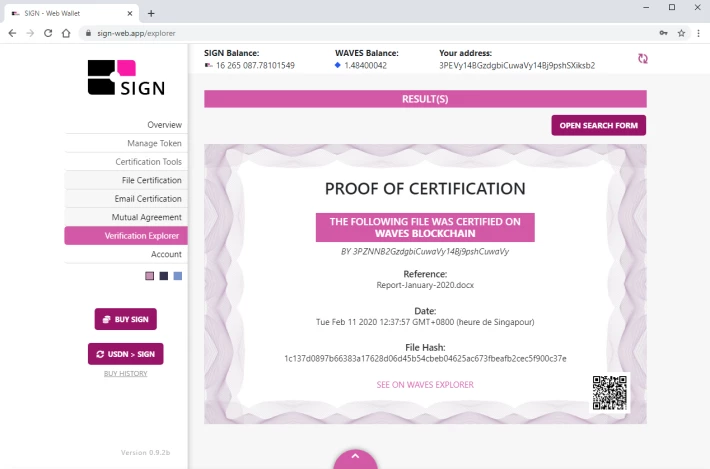
The latest release was for the Signature Chain web application version 0.9.5 on Mainnet which includes features such as Multi-Party Agreement, a Verification Explorer, Swap USDN for SIGN credit, and an improved UX.
3. Waves Release New Version Of Stagenet
A developmental update from the team includes the latest release for stagenet on their GitHub. Stagenet is pretty much the Waves testnet which allows developers to test the functionality of a new version of Waves before they are deployed on testnet and mainnet.
4. Waves Integrated Into Magnum Cryptocurrency Wallet
Waves have officially been integrated into the Magnum Cryptocurrency wallet. Magnum is a non-custodial wallet for over 700 cryptocurrencies and comes with a very easy-to-use interface. Waves holders can now manage and store their coins on the Magnum wallet.
5.Cost Analysis Paper For Smart Contract Execution Accepted At Blockchain20 Conference
Felix Adler, Dennis Kitzmann, and Marc Jansen recently released a paper detailing the cost for smart contract executions and concluded that smart contract execution is very cheap on the Waves platform. The paper is set to be released by Springer Nature soon.
6. Waves Release Referral Program
Lastly, Waves announced that it released a referral program that allows users to earn 20% of the fees generated by referees. This will certainly help to drive adoption on the Waves platform.
Waves (WAVES) Price Analysis
WAVES/USD - MEDIUM TERM - DAILY CHART
What Has Been Going On?
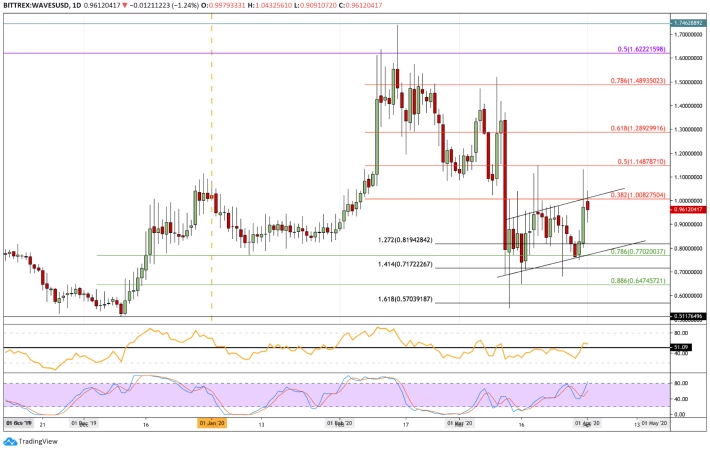
Taking a look at the daily chart above, we can see that WAVES saw a pretty stagnant start to the year as it traded sideways beneath the $1.00 during January 2020. However, in February 2020 it went on to increase by over 100% as it reached a high of around $1.76 before it reversed and rolled over.
During the Coronavirus pandemic panic, we can see that WAVES dropped into the support at the .786 Fibonacci Retracement level at around $0.77. The cryptocurrency did actually head slightly lower than this but rebounded at the support from $0.71, provided by a downside 1.414 Fibonacci Extension level.
Since rebounding, we can see that WAVES has been trapped within a shallow rising price channel and has been bouncing between the boundaries of this price channel.
Most recently, WAVES rebounded again from the support at $0.77 which allowed it to climb as high as $1.00 which is resistance provided by a short term bearish .382 Fibonacci Retracement level, measured from the Feb high to the March low.
It did attempt to break above the price channel but failed to do so as the last 2 candles closed beneath the channel.
Are We Bullish Or Bearish?
As we are trading within a price channel, we can consider the market as neutral at this moment in time. To turn bullish, the bulls would need to break above the channel and close above $1.00.
On the other hand, to turn bearish, the sellers would need to push beneath the channel and close beneath $0.77.
Where Can We Go From Here?
If the buyers do manage to break the current resistance at $1.00 and break above the channel, we can expect the first two levels of resistance to be located at $1.10 and $1.15 (bearish .5 Fibonacci Retracement level).
Above this, resistance is then located at $1.20, $1.29 (bearish .618 Fibonacci Retracement level), $1.40, and $1.49 (bearish .786 Fibonacci Retracement level). If they continue to drive WAVES above $1.50, additional resistance is located at $1.62 and $1.74.
Alternatively, if the sellers push lower, we can expect support at $0.90 and $0.80. Beneath this, support lies at $0.77 (.786 Fib Retracement), $0.71 (downside 1.414 Fib Extension), $0.64 (.886 Fib Retracement), and $0.57 (downside 1.618 Fib Extension).
The RSI recently managed to break above the 50 level for the first time since the March market collapse. This shows that the buyers are taking charge of the market momentum. If it can remain above 50 over the next few days we can expect WAVES to break above this current price channel.
WAVES/BTC - MEDIUM TERM - DAILY CHART
What Has Been Going On?
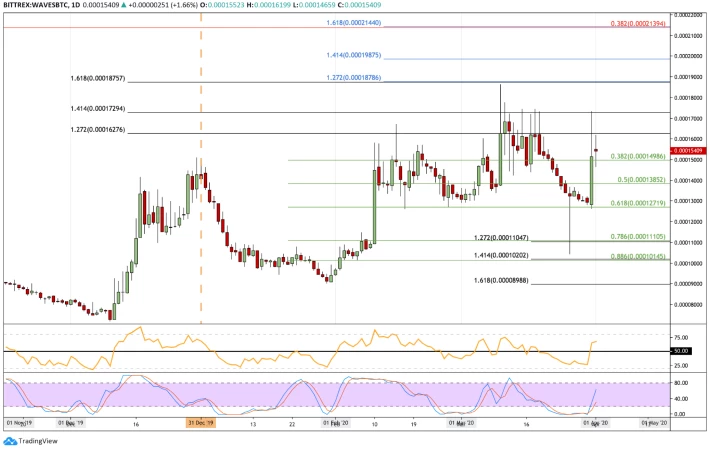
Against Bitcoin, we can see that WAVES has been performing pretty well during the March market turbulence and had actually made a fresh 2020 high before the collapse happened. Over the past 2-weeks, it has been dropping consistently but managed to find strong support at the .618 Fibonacci Retracement level at 12,720 SAT.
It rebounded from this support and climbed as high as 17,300 SAT yesterday. It has since dropped lower as it trades at the 15,300 SAT level.
Are We Bullish Or Bearish?
Right now, we are considered as neutral for WAVES/BTC. However, if the market can rise and close above the resistance at 17,250 SAT the market is likely to turn strongly bullish. To turn bearish, WAVES would need to crash and close beneath the support at 12,700 SAT.
Where Can We Go From Here?
If the bulls can rise above 16,000 SAT again we can expect higher resistance at 16,300 SAT, 16,800 SAT, and 17,250 SAT. Above this, resistance then lies at 18,000 SAT, 18,790 SAT (1.272 Fib Extension), and 19,875 SAT (1.414 Fib Extension).
If the buyers continue to drive above 20,000 SAT, additional resistance is expected at 21,000 SAT and 21,400 SAT (1.618 Fib Extension level).
On the other hand, if the sellers push lower, support lies at 15,000 SAT (.382 Fib Retracement). Beneath this, support lies at 14,000 SAT, 13,850 SAT (.5 Fib Retracement), 13,000 SAT, and 12,720 SAT (.618 Fib Retracement).
If the bears continue beneath here, added support is expected at 12,000 SAT, 11,000 SAT (.786 Fib Retracement), and 10,000 SAT (.886 Fiv Retracement).
The RSI is well above 50 which is a strong sign for the bulls. Additionally, the Stochastic RSI produced a bullish crossover signal that helped to push the market higher.






