
Hello traders,
Today I would like to try something a little different by providing some potential trading ideas that I have my eyes on. Remember these are just trading ideas and are not to be used as blind signals. You should always be conducting your own analysis and only be taking trades that you are willing to lose.
Disclaimer: THIS IS NOT FINANCIAL ADVICE
With that being said, here are some potential trading ideas that I have on my radar this week for some quick profits.
Ethereum - Long - Targets $197 (13%) - $218 (24%)

Analyzing the daily chart for Etheruem, we can see that the cryptocurrency managed to find some strong support during the March market collapse, caused by the Covid-19 outbreak, at the $105 level.
After finding the support here, ETH went on to rebound higher, however, it found strong resistance at the $140 level during the last half of March 2020 as it failed to break above this until April 2020.
After breaking above, we can see that ETH went on to surge higher to reach the resistance at $175, provided by a 1.414 Fibonacci Extension level. More specifically, it was unable to close above the resistance at the 100-day EMA level here.
It rolled over from the 100-day EMA last week to drop back into the support at the rising support trend line (drawn in pink).
In today’s trading session (April 14th) we can see that ETH has now bounced higher as it trades at $160.
The RSI has rebounded from the 50 level to signal that the bulls remain in charge of the market momentum. If the RSI can continue to remain above 50, we can certainly expect this pattern to play out.
What Pattern is Being Formed: This will be a simple break above resistance pattern. We can see that ETH was struggling at the $175 resistance level, making this the next level of resistance for the market to overcome before heading higher. In this pattern, the rising support trend line acts as an invalidation metric with a break beneath here signaling that the market will be headed lower.
Entry Positions: LONG with a closing candle on the 4HR chart above the $176 level. This will signal that the bulls are ready to break higher and head toward the target (mentioned below). You could actually go LONG right now if you have a higher tolerance to risk as the bounce of the RSI at the 50 level signals that the bulls are not ready to give up their control of the market momentum just yet.
All Stops should be beneath the rising support trend line, below $150.
Profit Targets: The first profit target is located at $197 which would net you a cool 13% if you were long at $176. The second, riskier, profit target is located at $218 which would result in a 24% profit.
What to Look Out For: After ETH breaks above $176, the $180 level will cause some form of resistance due to the 200-day EMA being located here. Above this, resistance will be found at $168 (1.618 Fib Extension) and $190 (bearish .618 FIb Retracement). The resistance at $190 could cause some problems for ETH as it is a bearish .618 Fib Retracement measured from the March high to low.
The next level of resistance is located at the round number of $200 and is followed up by resistance at $208 (1.618 Fib Extension - black).
If we start to roll over and break beneath $150, this trade would be invalidated.
ChainLink - Long - Targets $4.00 (+12%) - $4.22 (+18%)
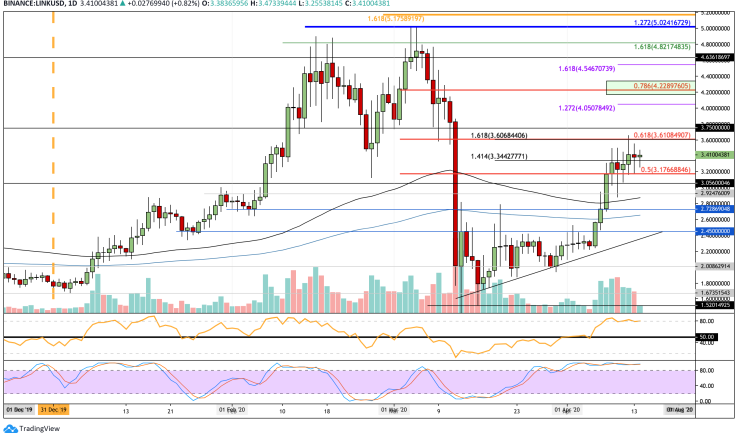
LINK has been on an absolute rampage after being able to increase by a total of 56% in the last 30-days. The cryptocurrency had rebounded from the post-Covid-19 market collapse at around $1.80 as it started to climb higher. It ran into resistance at around $2.45 and only broke this in the first week of April 2020.
After breaking $2.45, LINK went on to charge higher a it broke resistance at $2.60, $2.90, and $3.00. The cryptocurrency managed to break above strong resistance at $3.17 (bearish .5 Fib Retracement) as it currently trades sideways at the $3.40 level.
This will be an interesting few days for LINK as the market is starting to look a little sluggish over the past 3-days. However, if it can continue to break higher above $3.62, we might have an opportunity to ride the price increase higher toward $4.00 and perhaps even $4.22.
The RSI is looking overbought which is a bit worrying right now. This is why our entry price is above $3.62 because if the RSI starts to head lower it will cause LINK to head back to around $3.20 and invalidate this trade. However, if this is the case, there will still be an opportunity to go LONG at $3.20 but that is not what the following trade idea is based upon.
What Pattern is Being Formed: This will be a simple trend continuation pattern. The trend is your friend. Never go against the trend. If this trend is to continue higher, we would need to see a break and close above $3.61.
Entry Positions: Go LONG with a close above $3.62 on the 4HR charts. This will signal that the bulls are attempting to push the market higher and continue the previous bullish trend. The resistance here is pretty strong (provided by a bearish .618 Fib Retracement level) so we must be patient and wait for a close above this level before entering this trade.
All stops in this trade should be beneath $3.40 (probably just beneath $3.20) after a break of $3.60.
Profit Targets: The first profit target is located at $4.00 which would net a profit of around 12%. The riskier target is located at $4.22, the resistance provided by a bearish .786 Fib Retracement, and this would net a profit of around 18%.
What To Look Out For: As mentioned earlier, LINK is trading sideways and hanging in the balance. If the bullish momentum drops now and LINK heads toward $3.17, this could provide another opportunity to go LONG at a more favorable price level.
Nevertheless, even if LINK travels higher over the following few days, we should wait for the market to close above $3.62 before going long.
There will be some resistance at the $3.75 level but it will be important to hold your nerve here because a break above $3.62 is likely signaling a move to $4.00 at the very least.
Once $4.00 is broken, if you are still in the trade, there might be some higher resistance at $4.05 but if LINk can take this out it should reach the second profit target at $4.22.
Basic Attention Token - Long - Targets $0.20 (+15%) - $0.223 (+28.5%)
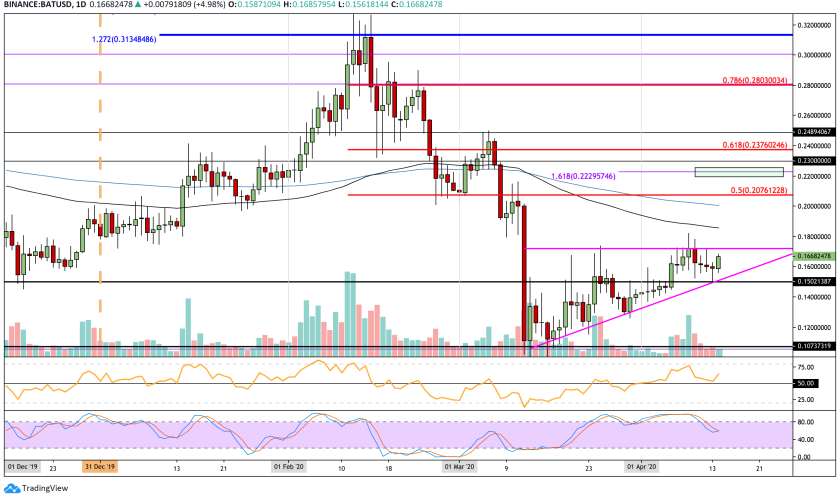
Basic Attention Token has seen a decent 30% price increase over the past 30-days after it managed to rebound from the support at $0.10. During the March market capitulation, the cryptocurrency had dropped to the $0.10 level where the market managed to rebound.
It has since been slowly grinding higher as it managed to remain above a short term rising support trend line. However, the cryptocurrency has been trapped with resistance at the $0.172 level and has been unable to overcome this level - causing an ascending triangle pattern to form.
We can clearly see BAT bouncing at the lower boundary of this pattern over the past month of trading and recently found support here again in yesterday’s (April 13th) trading session, where it rebounded higher.
The RSI has also recently rebounded from the 50 level to indicate that the buyers are still in control of the market momentum and not willing to give it up.
What Pattern is Being Formed: The pattern that is being formed here is an ascending triangle pattern. Once the cryptocurrency penetrated above the upper boundary, we can expect the market to continue higher and continue the bullish breakout.
Entry Positions: Go LONG with a break and close above the $0.172 level on the 4HR chart. It is important to wait for the close to prevent being caught in a false breakout signal. All stops in this trade would need to be below the lower boundary of the triangle (perhaps at $0.16 or $0.155).
If the market was to break beneath the triangle then this trade would be invalidated.
Profit Targets: The first profit target in this trade would be at $0.20 (200-days EMA) which would result in a 15% profit. The riskier profit target is located at $0.223 which would result in a 28.5% price increase.
What To Look Out For: Once the upper boundary of the triangle has been breached, there may be some resistance at the $0.18 level, due to the 100-days EMA being located here but if we can break above this we should most certainly be hitting $0.20 (200-days EMA).
If you are still in the trade above $0.2, there will be some turbulence between $0.2 and $0.207 due to resistance provided by a bearish .5 Fib Retracement. However, once this is broken, the second target should be hit.
Binance Coin - Long - Targets $18.05 (+12%) - $20 (+25%)

Binance Coin has also been on a rampage over the past 30-days of trading after increasing by a total of 50%. The cryptocurrency had dropped from a high above $20 to reach as low as $9.17 during the March market collapse, where it found support at a downside 1.618 Fibonacci Extension level.
After rebounding from here, Binance started to slowly grind higher and continued to ascend as April began trading. We can see that it met some resistance at $15.50 last week, causing it to fall back into the support at a rising trend line but it rebounded once again over the weekend to reach the current trading price at $15.94 as it meets resistance at a 100-days EMA.
It is a breakout of this 100-days EMA that will signal our trade for Binance Coin.
The RSI also managed to rebound at the 50 level during the weekend as it surges higher itself. It still has room to travel higher before becoming overbought which leads me to believe Binance should be hitting $18 at the very least - once $16 has been breached.
What Pattern is Being Formed: This will be another trend continuation pattern. The trend is most certainly bullish over the past few weeks and if the resistance at the 100-days EMA can be cleared, we can expect the trend to continue higher, possibly toward the $20 level.
Entry Positions: LONG after Binance Coin breaks above $16 on the 4HR chart. It could happen today which means you have to be very quick. Even if you miss the $16 level you can still enter up until $16.50 and ride the ascension.
If Binance was to roll over from here, we could see it headed toward the rising support trend line which would provide an even more favorable entry price.
Profit Targets: The first profit target is $18.05 which would net a 12% price increase. The riskier profit target is located at $20 which would result in a 25% price increase.
What To Look Out For: Once $16 is breached, we could see some turbulence at $16.74 (bearish .5 Fib Retracement) and $17.38 (200-days EMA). However, if we can break above these, the $18 profit target should easily be hit.If you are still in the trade above $18.00, there will be some strong resistance at $19.20 (bearish .618 Fib Retracement) before the higher $20 price target can be reached.


