
Tezos has absolutely skyrocketed this year after the cryptocurrency managed to increase by a total of 165% in 2020 alone! Now that is some serious gains for any sort of asset!
The cryptocurrency increased by a further 23% over the past 24 hours of trading, making it the strongest performing cryptocurrency out of the top 20 ranked projects.

The cryptocurrency has totally shocked pretty much everybody, thus far, in 2020 - blowing past everybody’s possible price predictions!
However, there is still much room to grow and my price prediction still stands for Tezos reaching $5.00 at some point during the year.
If you need to catch up on my 2020 prediction for Tezos, feel free to take a look at the article here. There is some great information on why Tezos might be moving so rapidly and its NYX standard for securities offering is probably one of the major driving forces.
So, where can we go from here? And are we too late to the party? Well, let’s take a look at both the USD and BTC charts against XTZ and see where we might be heading!
Tezos Price Analysis
XTZ/USD - MEDIUM TERM - DAILY CHART

What Has Been Going On?
Analyzing the daily chart above, we can pretty much see that Tezos was range-bound between $1.85 and $0.85 for the majority of the second half of 2019 as it was unable to break above this sideways movement.
2020 kicked off with Tezos bouncing at around $1.20 as it started to climb higher. January was a slow grind for Tezos as it continued to drive itself higher toward the 2019 price high at around $1.85.
It was February when things really started to take off for Tezos. The cryptocurrency exploded past the 2019 high and started to surge at an alarming rate! It blew past $2.00, $2.50, and even $3.00 to reach the current trading price of around $3.30.
The current resistance is provided by a short term 1.414 Fib Extension level and we can certainly expect Tezos to continue with this bullish trajectory and break past here pretty soon.
Where Can We Go From Here?
Well, after surging well past the 2019 highs, Tezos is still well and truly bullish. It would need to drop back beneath $2.00 before this bullish trend becomes invalidated and would need to drop further past $1.50 to turn bearish.
If the sellers do start to pull back from here (a retracement does HAVE to happen at some point), we can expect the first 2 levels of support to be located at $3.14 and $3.00.
If the sellers continue to push Tezos further beneath $3.00, additional support is then to be expected at $2.87 (.236 Fib Retracement), $2.56 (.382 Fib Retracement), $2.50, $2.31 (.5 Fib Retracement), and $2.05 (.618 Fib Retracement).
I do not expect Tezos to head so low, however, above are the support levels I will be watching if it does start to retrace.
What If We Don’t Even Pull Back?
Well, if we don’t even see a retracement and Tezos continues to rocket above the $3.34 resistance level, higher resistance will be expected at $3.50, $3.64 (short term 1.618 Fib Extension), and $3.80 (long term bearish .618 Fib Retracement). This bearish Fibonacci Retracement level is measured from the June 2018 high to the December 2018 low - so yeah, pretty long term!
Above $3.80, resistance lies at $3.93 (short term 1.414 Fib Extension), $4.00, $4.20 (1.618 Fib Extension), and $4.45. Additional resistance above this is expected at $4.74 (bearish. 786 Fibonacci Retracement) and then at my 2020 price target of $5.00.
If Tezos blows past my 2020 target I will come back to update you guys on some further higher levels.
Let us continue to take a look at Tezos against Bitcoin to see how late we might be to the party.
XTZ/BTC - MEDIUM TERM - DAILY CHART

What Has Been Going On?
Looking at the daily chart above for Tezos against Bitcoin we see a slightly different scenario at play. Tezos was actually performing pretty well against Bitcoin during November and December 2019 and the cryptocurrency only just managed to break above this level of resistance over the past few days!
In February 2020, Tezos passed the November highs at 0.00024 BTC and continued to break above the 2019 highs at 0.000267 BTC just recently.
We can see that it has approached resistance at 0.00032 BTC which is provided by a long term bearish .382 Fib Retracement level. This particular Fib Retracement is measured from the June 2018 high to the December 2018 lows.
Where Can We Go From Here?
So, where can we go from here? If the bulls manage to crack 0.00324 BTC, the next level of resistance lies at 0.000356 BTC and 0.000363 BTC. Above this, higher resistance is located at 0.00040 BTC which is provided by the bearish .5 Fibonacci Retracement level.
IF the bulls continue to break above 0.0004 BTC, resistance lies at 0.000428 BTC and 0.00043 BTC. Above 0.00045 BTC, resistance lies at 0.000474 BTC (bearish .618 Fib Retracement), 0.00048 BTC, and 0.00050 BTC.
Id we pull back from here, the first level of support lies directly at 0.0003 BTC. Beneath this, additional support lies at 0.000285 BTC (.236 Fib Retracement), 0.000267 BTC, 0.00026 BTC (.382 Fib Retracement), and 0.00023 BTC (.5 Fib Retracement).
Too Late To The Party?
So, are we too late to the party? Well, that all depends on how much of a return on your investment you are expecting. If you are expecting over 1000% then, yes, you are certainly too late to the party. However, if you are expecting 1000% on any asset, then you really need to go back and learn some more about investing because this is not a normal level of expectation from any market.
The only way to truly see how much growth is ahead is to look at the overall picture.
Let me zoom out on the charts for you to take a look;
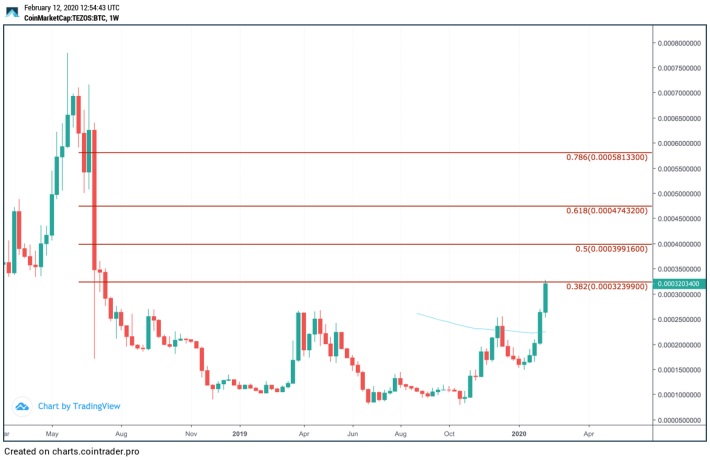
Looking at the weekly chart certainly puts the latest bullish run into perspective. Yes, the cryptocurrency has surged by a total of around 120% in 2020 so far. However, you can clearly see that there is SO MUCH room ahead to grow into!
In fact, if we were to reach the previous all-time high price, this would constitute a 141% price increase from the current resistance level - a pretty nice return still! Of course, you are taking a higher risk now to invest than if you had invested at the start of 2020.
However, the all-time high is not even the ceiling.
If Tezos can follow through on the plans it has over the following years, especially with the NYX standard for STO’s, this thing is bound to make some fresh all-time highs.
Conclusion
Tezos has certainly seen some great returns within the market in 2020. However, you should not feel that you are too late to the party just yet as there is TONS of space to grow into in the months to come.
The market is very extended right now and I would wait for a slight pullback before entering into any fresh positions, however, over the longer term, I do believe Tezos is most certainly going to continue this bullish run and reach my previous 2020 price target of $5.00, at the very least.
NOTE: As always, none of this is to be deemed as financial advice and you should only ever invest funds that you can afford to lose!
Happy Trading!


