
Well, it finally happened.
After block number 630,000 was mined by AntPool on May 11th, 2020, the 3rd Bitcoin Block Halving event finally occurred as the Bitcoin mining subsidy was slashed in half from 12.5 BTC per block to just 6.25 BTC per block.
This puts enormous pressures on mining operations across the globe as they are now effectively earning 50% less BTC mining rewards per block than they were earning yesterday. Some of the smaller mining operations will be forced to close down as they are likely not to be earning enough BTC to be able to cover their electricity and overhead costs.
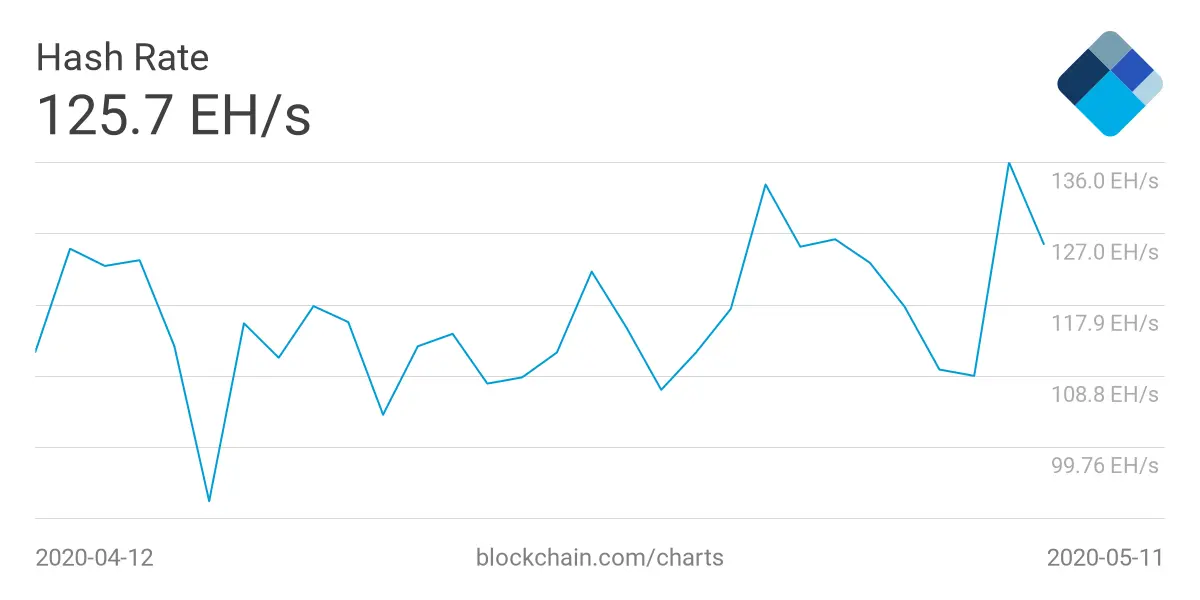
Nevertheless, there does not seem to be a severe drop in the hash rate just yet as it drops slightly from 136 EH/s to beneath 127 EH/s.
Despite this network economic changing event, not much action has been on the price of Bitcoin. The price for the cryptocurrency has increased by a total of 4% over the past 24 hours of trading (May 12th) as it attempts to climb back above $9,000, however, this is likely to be much less of an increase than most in the industry expected. This is a strong sign that the Bitcoin Block Halving event might have already been priced in before the event actually occurred.
This is especially true when we consider the fact that BTC increased by a total of 108% since the March market collapse which was caused by the Coronavirus pandemic uncertainty. BTC recovered these losses during this 108% price increase as it managed to rebound from the $4,800 level and reach as high as $10,000.
Over the weekend, May 8th, Bitcoin fell quite substantially from the $10,000 high and spiked as low as $8,100. It found strong support at $8,600 and has been trying to recover from this level ever since.
This price drop from $10,000 also caused other cryptocurrencies to drop lower with Ethereum falling beneath $200 to reach $185 and XRP dropping beneath $0.20 to reach as low as $0.192. Both cryptocurrencies have rebounded after the halving and we will go over their respective price analysis later in the article.
With the Bitcoin Block Halving past us, we can start to look at other fundamental driving factors that might be affecting the entire economy.
For example, Paul Tudor Jones has entered the market as he puts 1-2% of his total assets into Bitcoin futures through his fund, Tudor Investment Corporation. Don’t let the low single-digit fool you - 1% or 2% of $40 billion is very significant. Jones believes that Bitcoin will play a growing role as a hedge during “The Great Monetary Inflation” period as the Federal Reserve continues to pump money into the economy.
In fact, if we take a look at the FED treasury purchases below we instantly start to gain a perspective of how much money they are actually pumping into the economy.
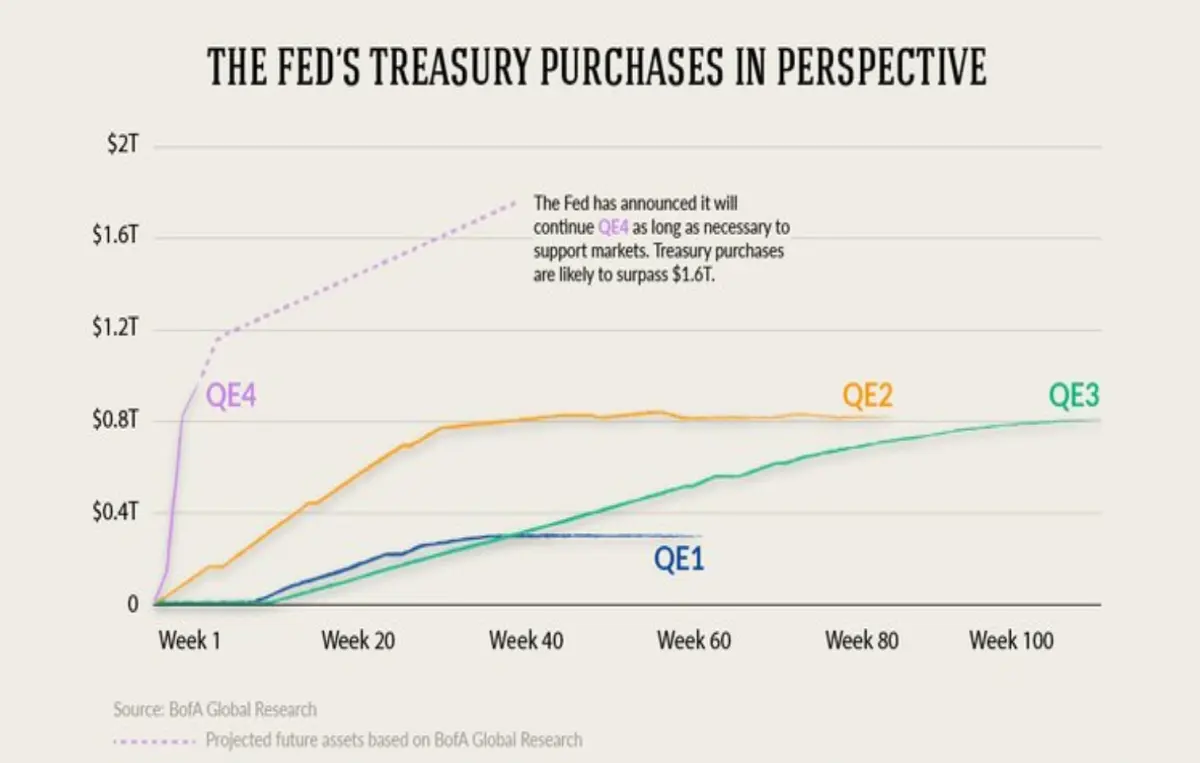
In just a little over 1 week from starting QE4 (Quantitative Easing round 4), we can see that they have already injected double the amount of money into the economy than that of 60 weeks of injections in QE1. They have also pumped more money into the economy than that of the 80 weeks of QE2 and the 120 weeks of QE3 - all in just 1 week of QE4!
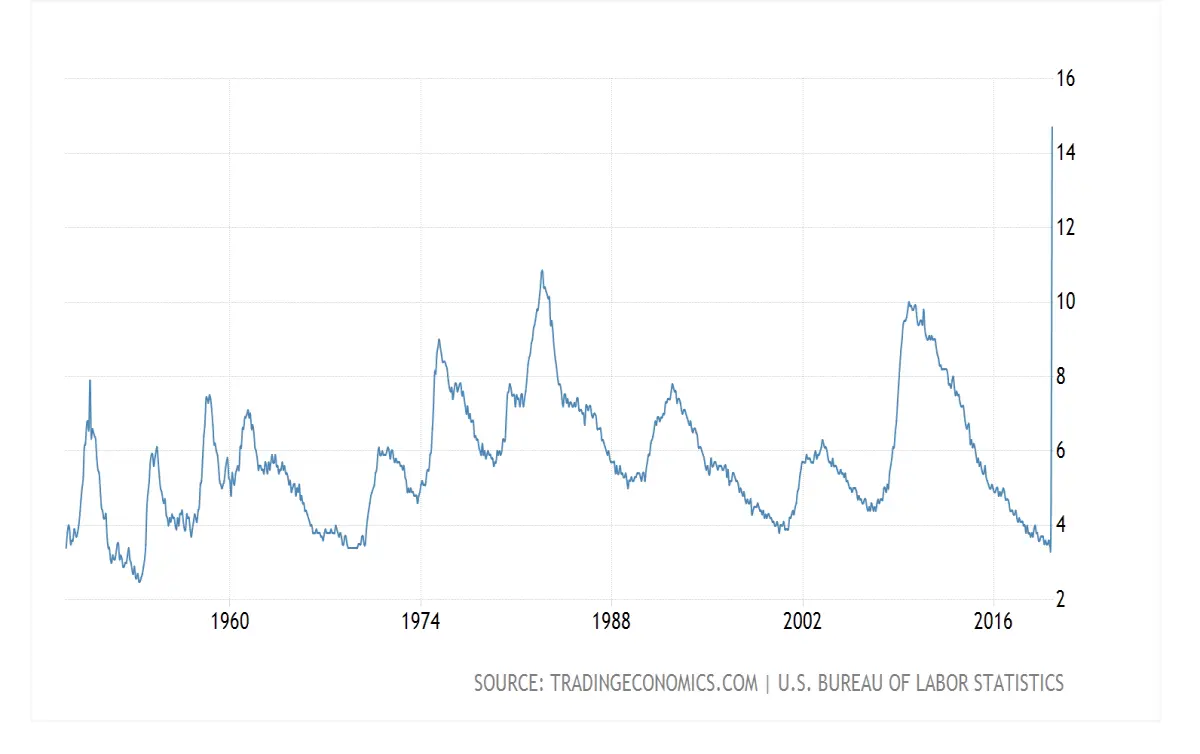
This truly puts into perspective the amount of money the FED is printing to combat the economic effect that the Coronavrisus pandemic has caused for the US economy. This is not surprising when we consider the fact that the unemployment rate for the USA has reached above 14%, a figure never seen before in their entire history;
If we take a look at the chart comparing BTC (orange) to the S&P 500 (red) below we can see that Bitcoin has been outperforming the US stock market by a significant amount in 2020;
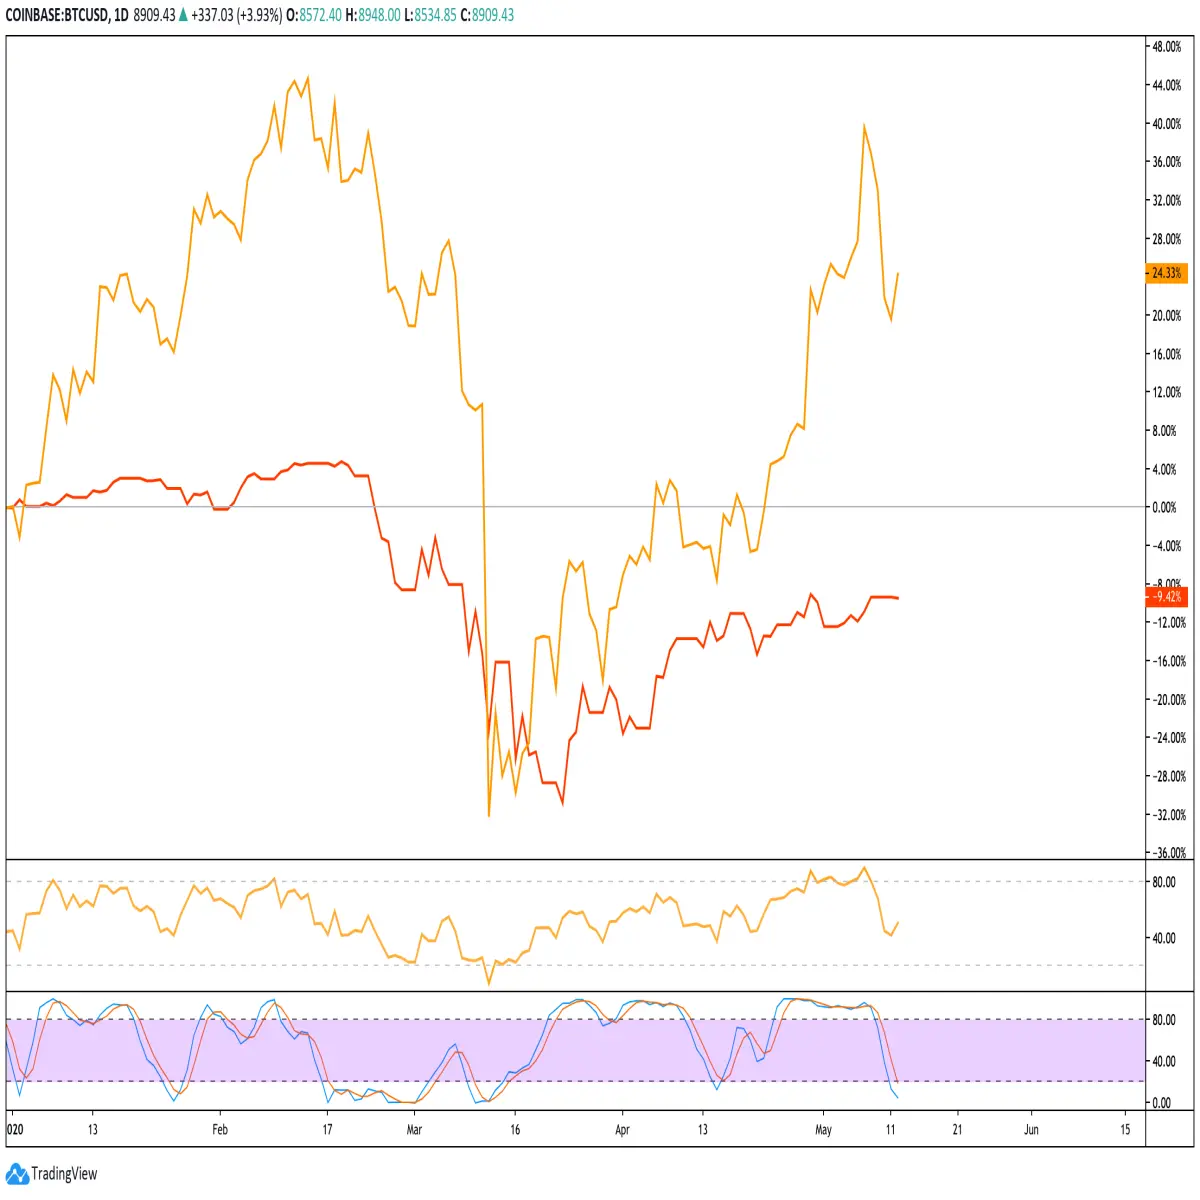
Since the beginning of 2020, Bitcoin has increased by a total of 24% whilst the S&P 500 has dropped by around 9%.
J.P. Morgan has even decided to enter the industry as the $2.6 trillion banking giant opens up accounts for Bitcoin exchanges for Coinbase and Gemini - even though its CEO, Jamie Dimon, is constantly making statements that “Bitcoin is a fraud”. This partnership will now allow deposit, withdrawal, and transfer services for Coinbase and Gemini customers with their Automated Clearing House (ACH) infrastructure.
Although J.P. Morgan is not buying Bitcoin themselves, they are creating better banking relationships for the top tier exchanges which is something that they have all struggled with over the past decade.
Right, let us get into the analysis!
Bitcoin Price Analysis
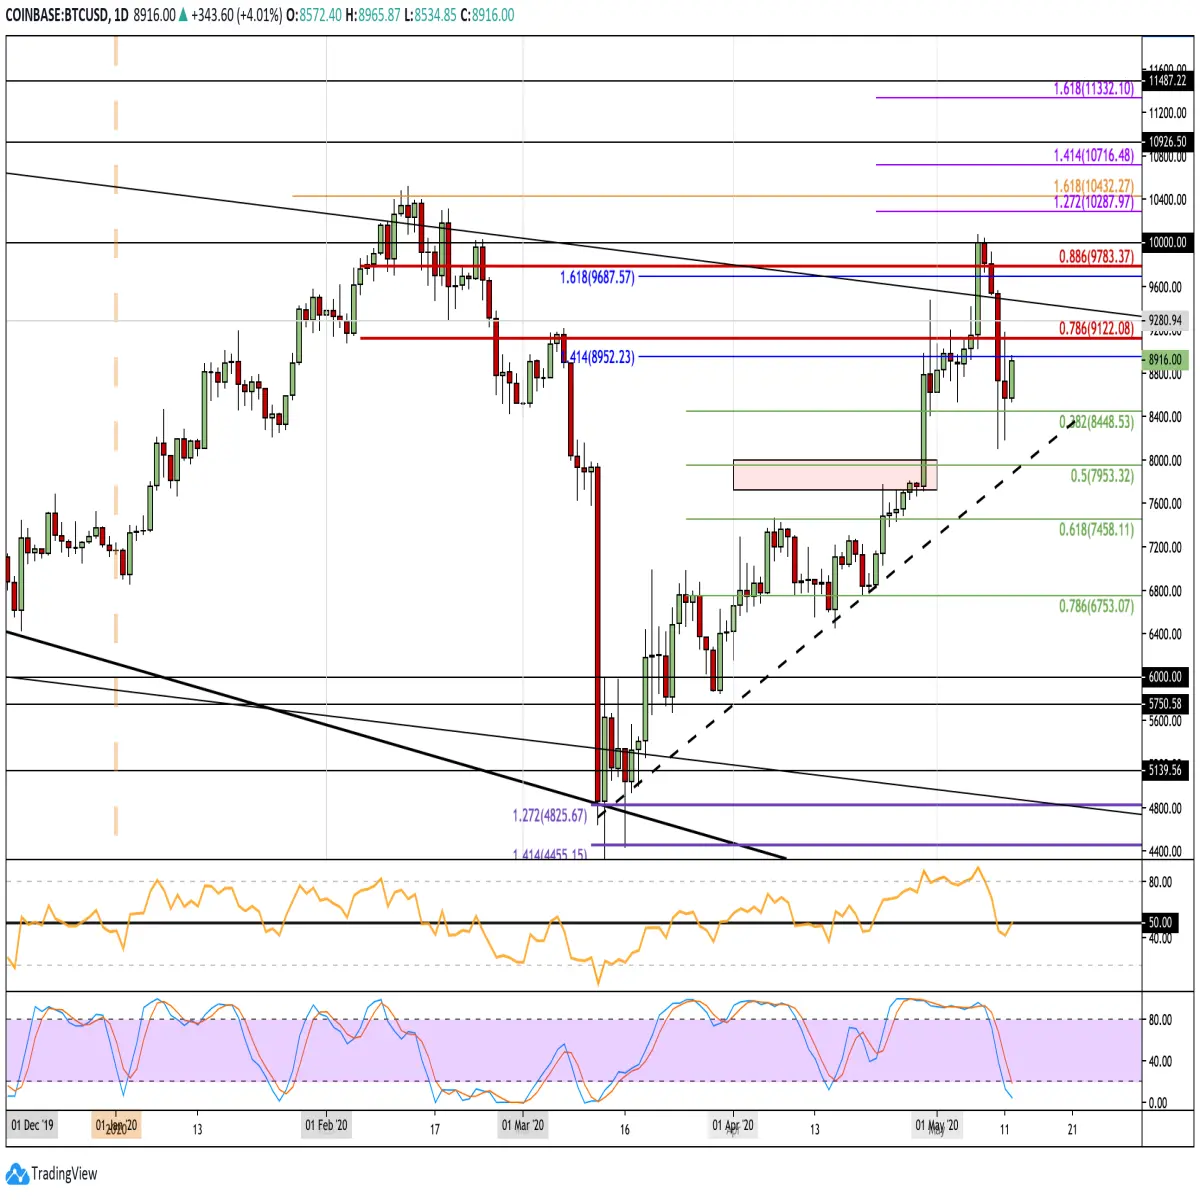
BTC/USD - From 2020 Onward - DAILY CHART
What Has Been Going On?
Taking a look at the daily chart above, we can clearly see Bitcoin’s bullish run as the halving approached. The cryptocurrency had surged from the April low of around $6,400 and started to climb much higher throughout the month. By the end of April, Bitcoin was trading at $8,950 as it was facing resistance at the 1.414 Fib Extension level.
In May, Bitcoin went on to break further above this level of resistance as it started to push further higher. It broke past resistance at $9,122 (bearish .786 Fib Retracement) and $9,783 (bearish .886 Fib Retracement) to reach as high as $10,000.
Over this past weekend, May 9th, we can see that BTC fell from this $10,000 and dropped beneath $9,000 to reach the support at $8,400 (.382 Fib Retracement). This was quite a surprising drop for many investors as it occurred just 3-days before the halving event when most were expecting BTC to continue higher above the $10,000 level.
BTC managed to hold this support and has started to push higher back toward $9,000 on the day after the halving event (May 12th). It is now facing the same resistance that it faced toward the end of April 2020 at $8,950.
Are We Bullish Or Bearish?
Although BTC did drop lower, we are still bullish over the short term. However, if BTC was to drop beneath the $8,400 support the market would be considered as neutral. It would need to fall further beneath the support at $7,400 to turn bearish.
Where Can We Go From Here?
Well, we can expect a whole lot of volatility over these next few weeks. There will be some big changes in the hash rate as miners start to close their operations down when they become unprofitable and the number of BTC coming into exchanges from miners is already reduced by 50%. This means there will be a reduced influx of supply on the market. So long as the demand stays similar, or increases, we can expect Bitcoin to continue to push higher.
If the buyers can reclaim the $9,000 level, the first level of resistance is expected at $9,122. Above this, resistance is found at $9,500, $9,783 (bearish .886 Fib Retracement), and $10,000.
If the buyers can continue to drive Bitcoin further higher from the $10,000 level, added resistance is located at $10,287 (1.272 Fib Extension - purple), $10,432 (2020 price high), $10,500, and $10,716 (1.414 Fib Extension). This is followed by resistance at $11,000.
On the other side, if the sellers push lower, the first level of support is expected at $8,400 (.382 Fib Retracement). Beneath this, support lies at the rising support trend line, $8,000, and $7,950 (.5 Fib Retracement).
This is followed up with added support at $7,458 (.618 Fib Retracement), $7,200, and $7,000.
The RSI dipped beneath the 50 line over the weekend when BTC dropped back beneath $9,000. However, with the latest price rise, it is trying to climb back above it. For a push toward $10,000 again, we must see the RSI breaking the 50 level to show the bulls have taken charge of the market momentum.
Ethereum Price Analysis
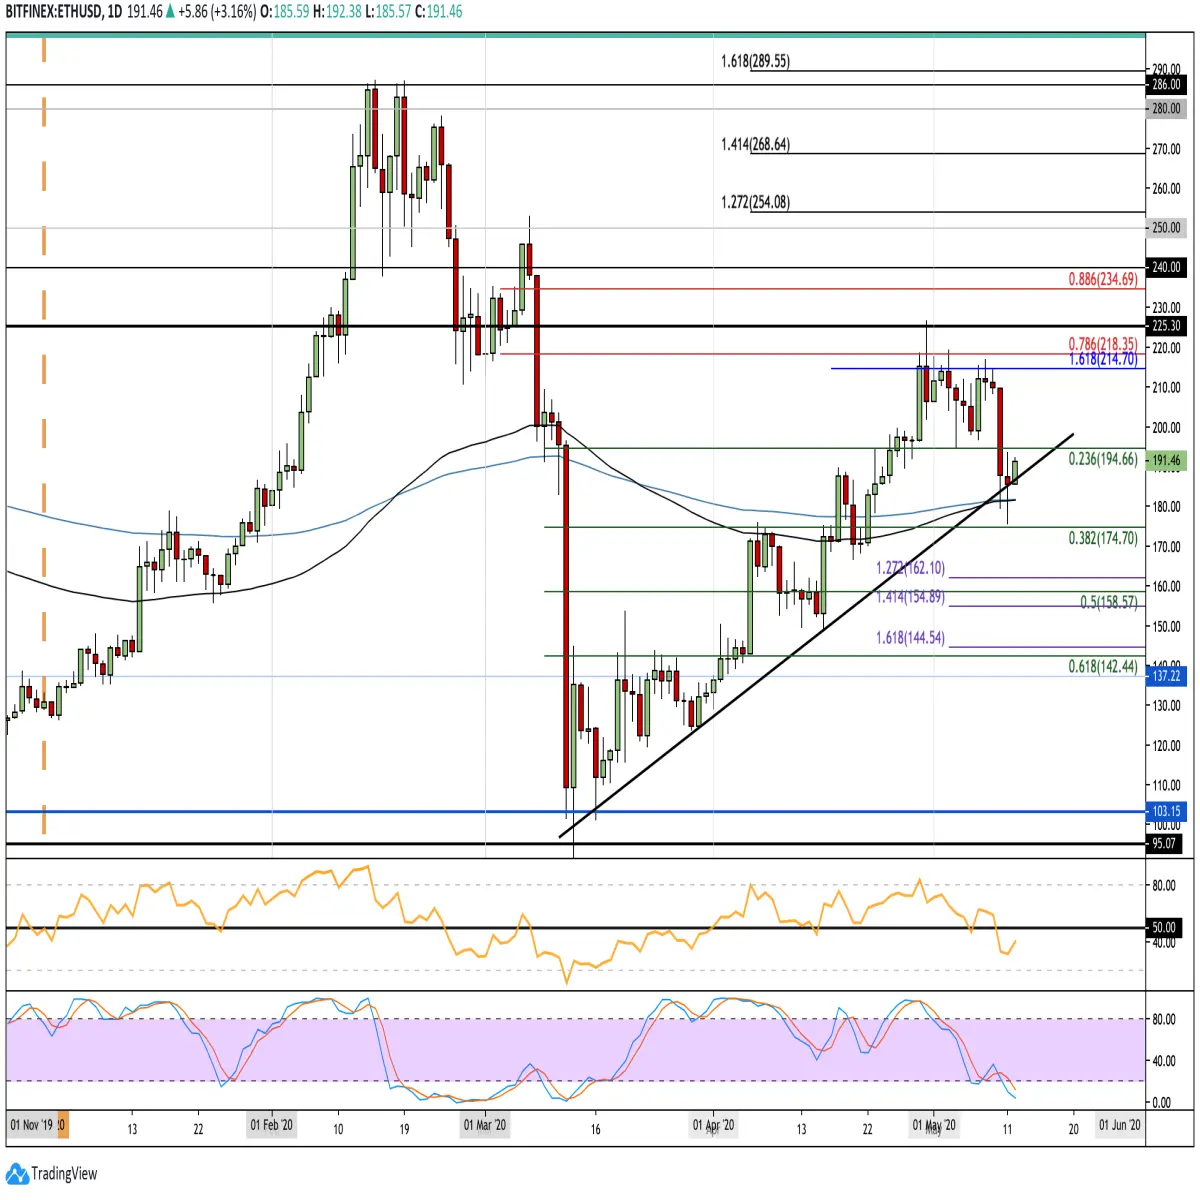
ETH/USD - From 2020 Onward - DAILY CHART
What Has Been Going On?
Ethereum performed relatively well during April as the cryptocurrency managed to increase by a total of around 75% as it surged from the April opening price of $133 to reach a high of around $225. Unfortunately, it was never really able to close above the resistance at $214, provided by a 1.618 Fibonacci Extension level.
During the first week of May, Ethereum traded sideways between $195 and $214. However, during the weekend market drop, Ethereum fell beneath $195 to reach as low as $175. It quickly managed to rebound and closed above the rising support trend line - keeping the bullish trend in-tact.
We can see that Ethereum has now rebounded from this support trend line as it makes its way back toward the $200 level.
Are We Bullish Or Bearish?
As we rebounded from the rising trend line, the market is still bullish in the short term. If it was to close beneath $180 (200-days and 100-days EMA) it would be considered as neutral with a further drop beneath $160 dictating a bearish trend.
Where Can We Go From Here?
If the buyers can continue with this rebound from the rising trend line and push higher, the first two levels of resistance are located at $195 and $200. Above this, resistance is expected at $214, $218 (bearish .786 Fib Retracement), and $225 (April 2020 high).
If the bullish pressure continues to drive Ethereum higher, resistance is then expected at $235 (bearish .886 Fib Retracement), $240, and $250.
On the other side, if the sellers push beneath the rising trend line, support is firstly located at $180 (100-days and 200-days EMA convergence). Beneath this, support lies at $175 (.382 Fib Retracement), $162, and $160. This is followed by added support at $158 (.5 Fib Retracement), $150, $144, and $142 (.618 Fib Retracement).
The RSI fell beneath the 50 line to indicate the bears are controlling the market momentum. For a push back above $200, we must see the RSI reclaiming the 50 line at the very least.
Ripple Price Analysis
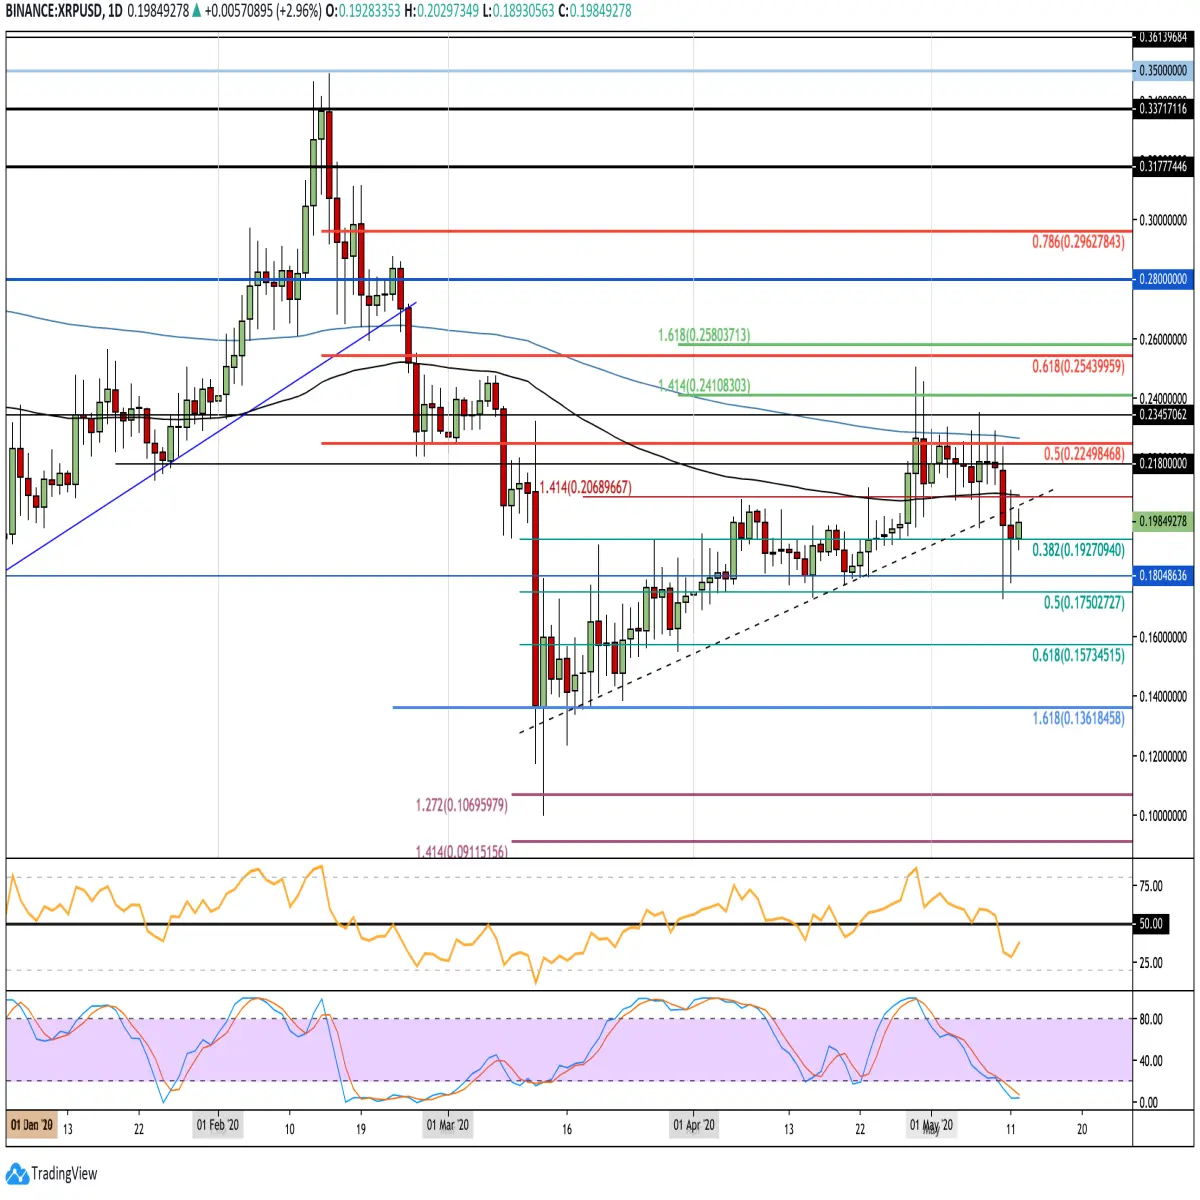
XRP/USD - From 2020 Onward - DAILY CHART
What Has Been Going On?
Ripple had a few weeks of interesting price action. The cryptocurrency struggled greatly with breaking the resistance at the $0.20 level. It finally managed to break above this toward the end of April but then found higher resistance at the 200-day EMA at around $0.226.
In the first week of May, the coin was trading sideways between the 200-days EMA and the 100-days EMA at $0.206. Unfortunately, the coin dropped beneath the 100-days EMA when BTC dropped beneath $9,000 this weekend. In doing so, XRP fell beneath its own rising trend line.
Luckily, XRP managed to find support at the .382 Fib Retracement level at $0.192 and has rebounded from here as it tries to break the $0.20 level again.
Are We Bullish Or Bearish?
Right now XRP is neither bullish nor bearish. It is currently neutral. It would need to break above the 200-days EMA to turn bullish again whilst on the other side, a break beneath $0.175 would turn the market bearish.
Where Can We Go From Here?
If the buyers can reclaim the $0.2 level, higher resistance is located at $0.206 (100-days EMA). This is followed by added resistance at $0.218, $0.226 (200-days EMA), $0.234, and $0.241.
Above this, further resistance is located at $0.254 (bearish .618 Fib Retracement), $0.26, $0.28, and $0.296 (bearish .786 Fib Retracement).
On the other side, if the sellers push beneath the current $0.192 support, we can expect support below at $0.18, $0.175 (.5 Fib Retracement), and $0.16.
Likewise, the RSI is now trading beneath the 50 line as the sellers dominate the market momentum. Luckily the Stochastic RSI is primed for a bullish crossover signal that should help to send the market higher if it occurs.






