
Hello traders!
Despite Bitcoin dropping by a total of 7.3% and Ethereum falling by a steeper 15% over the past month - there are some signs that we might be heading out of this phase of consolidation.
In this analysis, I have many fundamentals to cover before getting to the technical analysis for both Bitcoin & Ethereum.
Let me not waste any time and get right to business!
Bitcoin Overview
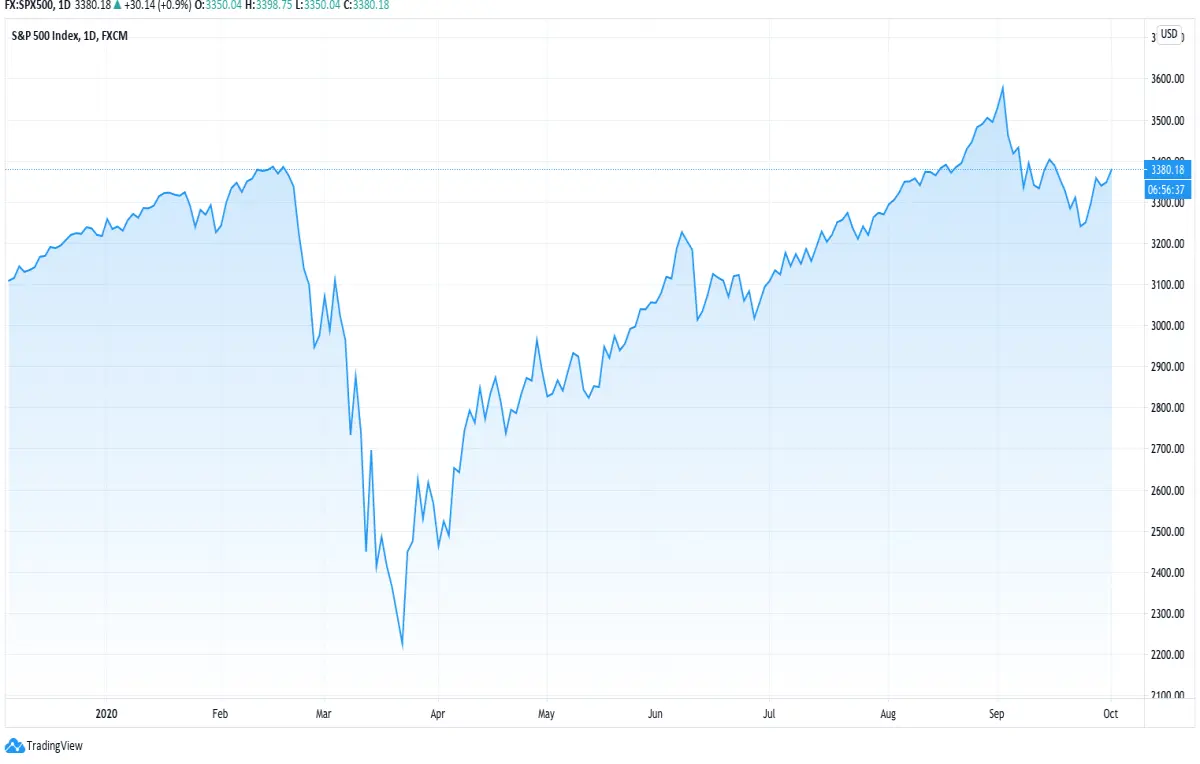
First and foremost, the overall economy is still in bad shape. It might not seem this way if you were to take a quick look at the S&P 500 reaching all-time highs again last month;
However, taking a look at the health of the US Dollar shows a different picture;
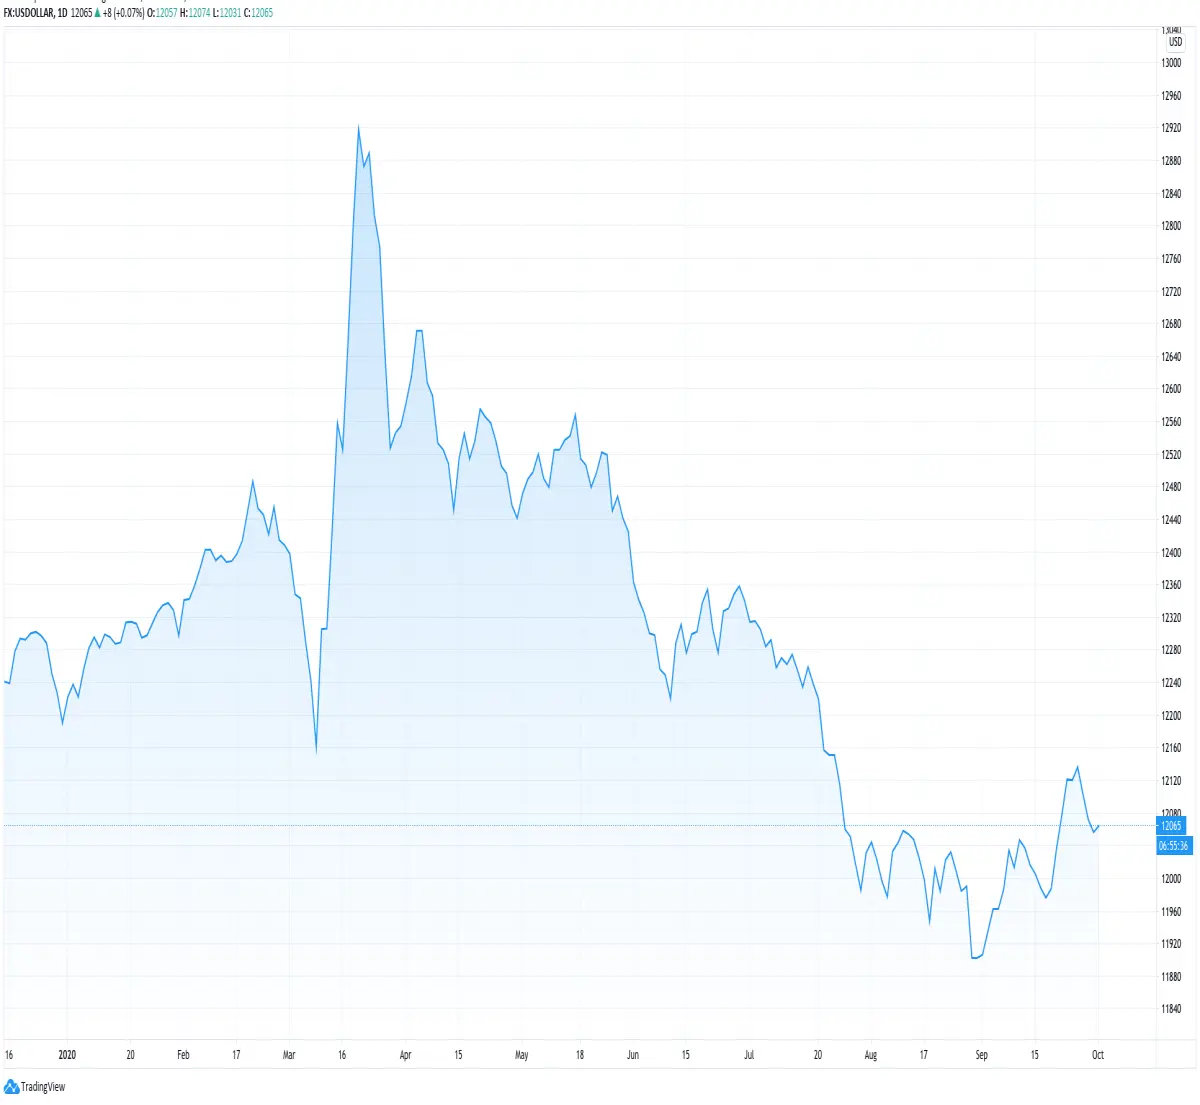
As you can see, the US Dollar has been falling since mid-March - right when the uncertainty started regarding the Coronavirus pandemic, and the US FED began to print money to combat this.
Of course, these stimulus measures are required to save a failing economy - however, they are incredibly detrimental to the US Dollar itself. This is because, when the FED prints more money, it destroys the purchasing power of dollars inside everybody’s pockets. As a result, investors typically start to re-arrange their funds as holding US Dollar assets becomes unprofitable. Usually, they move into safe-haven assets such as Gold - however, this time around, there is also another option for hedging - through Bitcoin.
Well, it does seem that the incoming stimulus is far from over.
Just this week, the Democrats unveiled a new $2.2 trillion relief bill to kickstart further stimulus negotiations in Congress, and it seems that discussions might be making progress. Steven Mnuchin, Treasury Secretary, stated that there is good news in that they have reached an agreement and, if the deal goes through, there will be another stimulus check for every eligible US citizen.
What does this even mean?
In short, it means that US Citizens will receive a stimulus check for $1,200 if the deal is reached and finalized. That is like receiving an airdrop of $1,200 in the crypto markets.
What will citizens do with this?
They are likely to put it in the stock market and Gold - or possibly buy Bitcoin.
Regardless of what US Citizens will do with their stimulus checks, we need to remember that they are printing money to make this happen - which is terrible for the US Dollar but good for safe-haven assets such as Gold and Bitcoin. Bitcoin trader, Tone Vays, sees things quite similarly;
He states that “no matter who wins the election, they will keep printing money, so buy Bitcoin.” and he is quite right.
Moving on, the on-chain analyst, Willy Woo, has posted some interesting findings in which he sees some bullish divergence - a good sign for Bitcoin. He Tweeted the following post, which shows that the influx in new BTC participants has not yet been reflected in the price - a concept known as bullish divergence;
As you can see, the chart shows the number of new entities in BTC is rising while BTC’s price continues to move sideways, giving rise to bullish divergence. He continues to end his tweet series by stating that he thinks it is a great time to build multi-month long positions as he believes the market will be bullish over the next three months.
It seems that Willy Woo is not the only analyst/institution that is extremely bullish on Bitcoin. Just over the past couple of weeks, it appears that two significant crypto hedge funds, Grayscale Investments and Microstrategy (a Nasdaq publicly-listed billion-dollar company), have significantly increased their BTC holdings.
MicroStrategy had bought 16,800 BTC in mid-September to increase their total holdings to around 38,250 BTC, which cost them $425 million in total. On the other side, Grayscale added a total of 17,100 BTC to their holdings this week - bringing their total holdings to a whopping 449,900 BTC, worth around $4.9 billion;
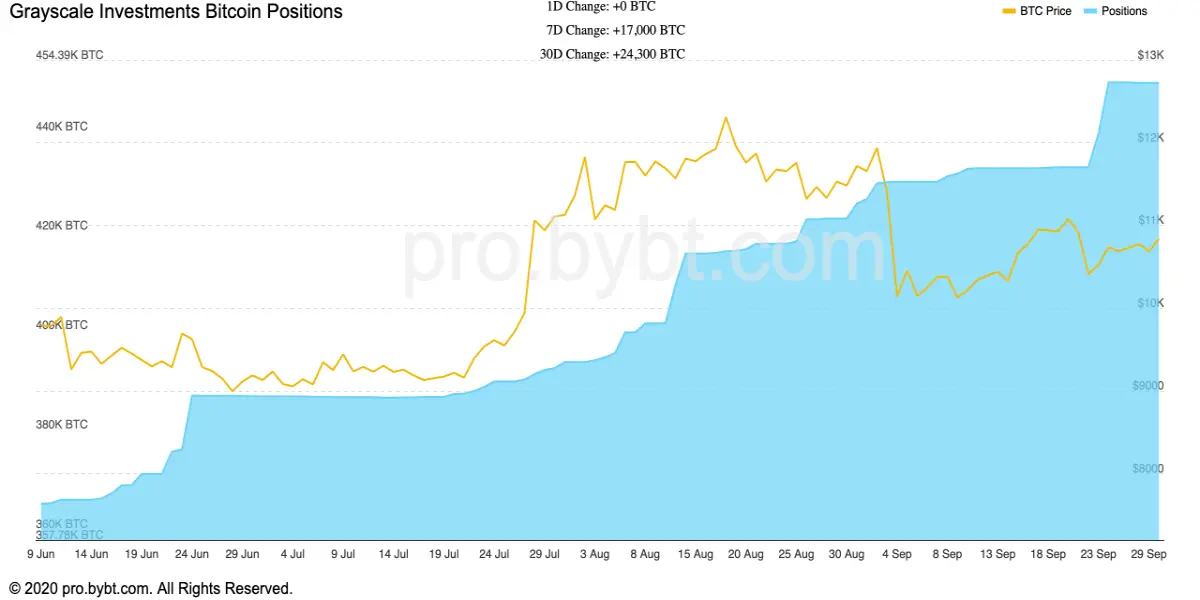
This means that Grayscale owns a total of 2.4% of the overall BTC supply!
With hedge funds like these aggressively purchasing BTC to increase their exposure, it CERTAINLY is an excellent bullish sign for the next few months.
Additionally, it seems that HODLers are controlling over 63% of the current BTC supply. Data from Glassnode shows that 63% of the total BTC supply has not moved in over one year now, suggesting that people decide to hold rather than sell. In addition to this, the data shows that almost 31.4% of the entire BTC supply has not moved in OVER THREE YEARS! You can see the data in the Tweet below;
This sentiment is reflected in the following distribution chart from Santiment;
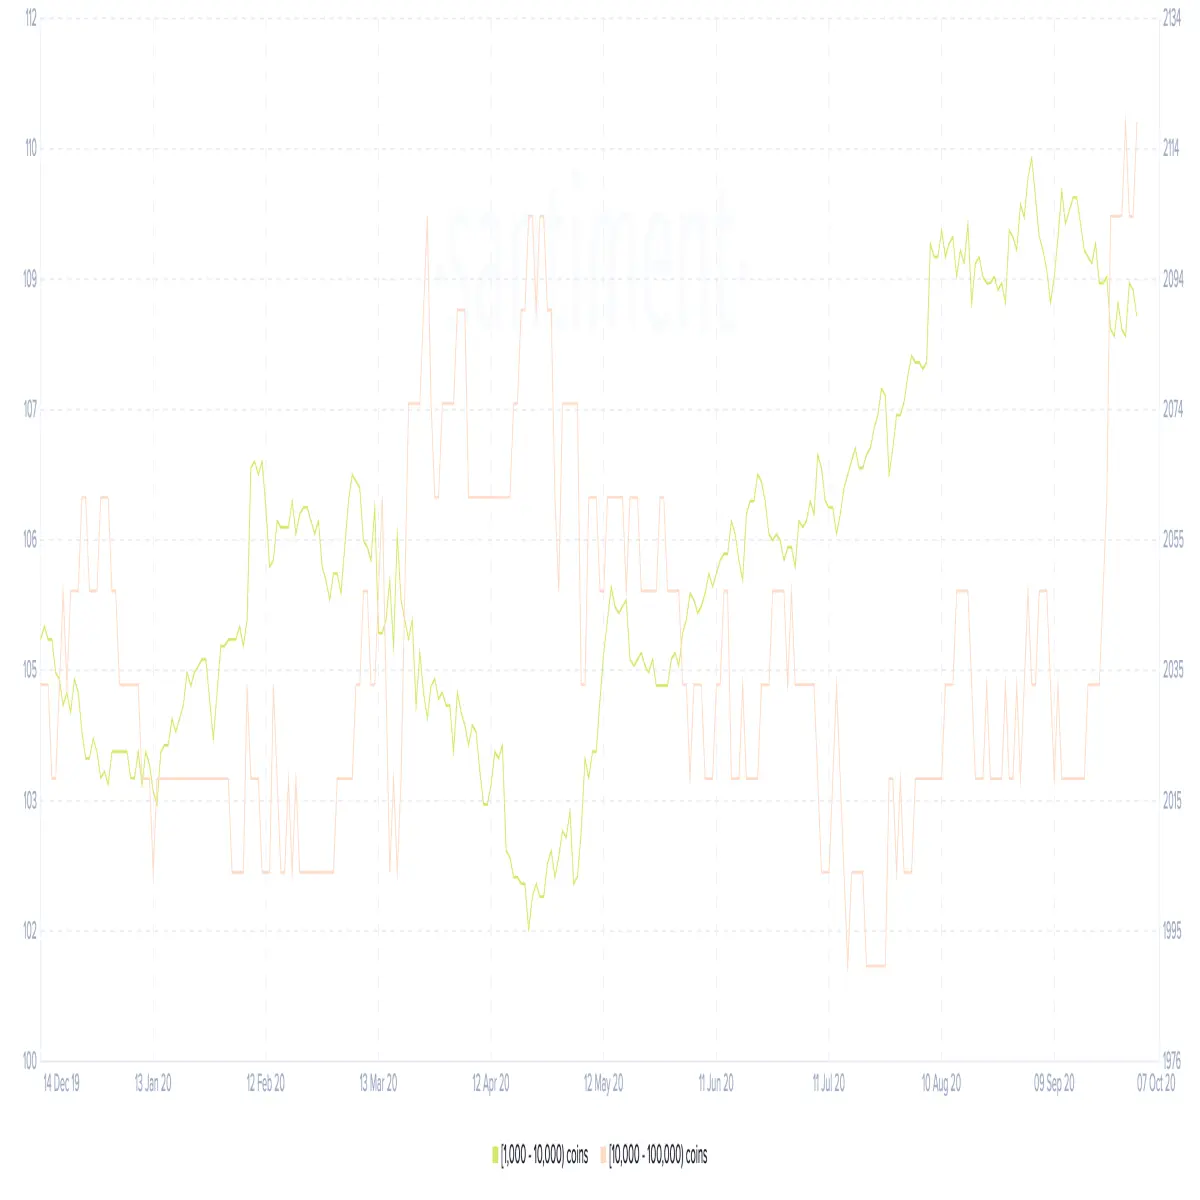
It shows that whales with 1000-10,000 BTC have been slowly increasing holdings since April. It also shows that whales with 10,000-100,000 BTC have increased - indicating more whales are entering the market.
Well, I think that is enough fundamentals for now. With them out of the way, let us look at the technical side of the market.
Bitcoin Price Analysis
BTC/USD - From July 2020 Onward - DAILY CHART
What Has Been Going On?
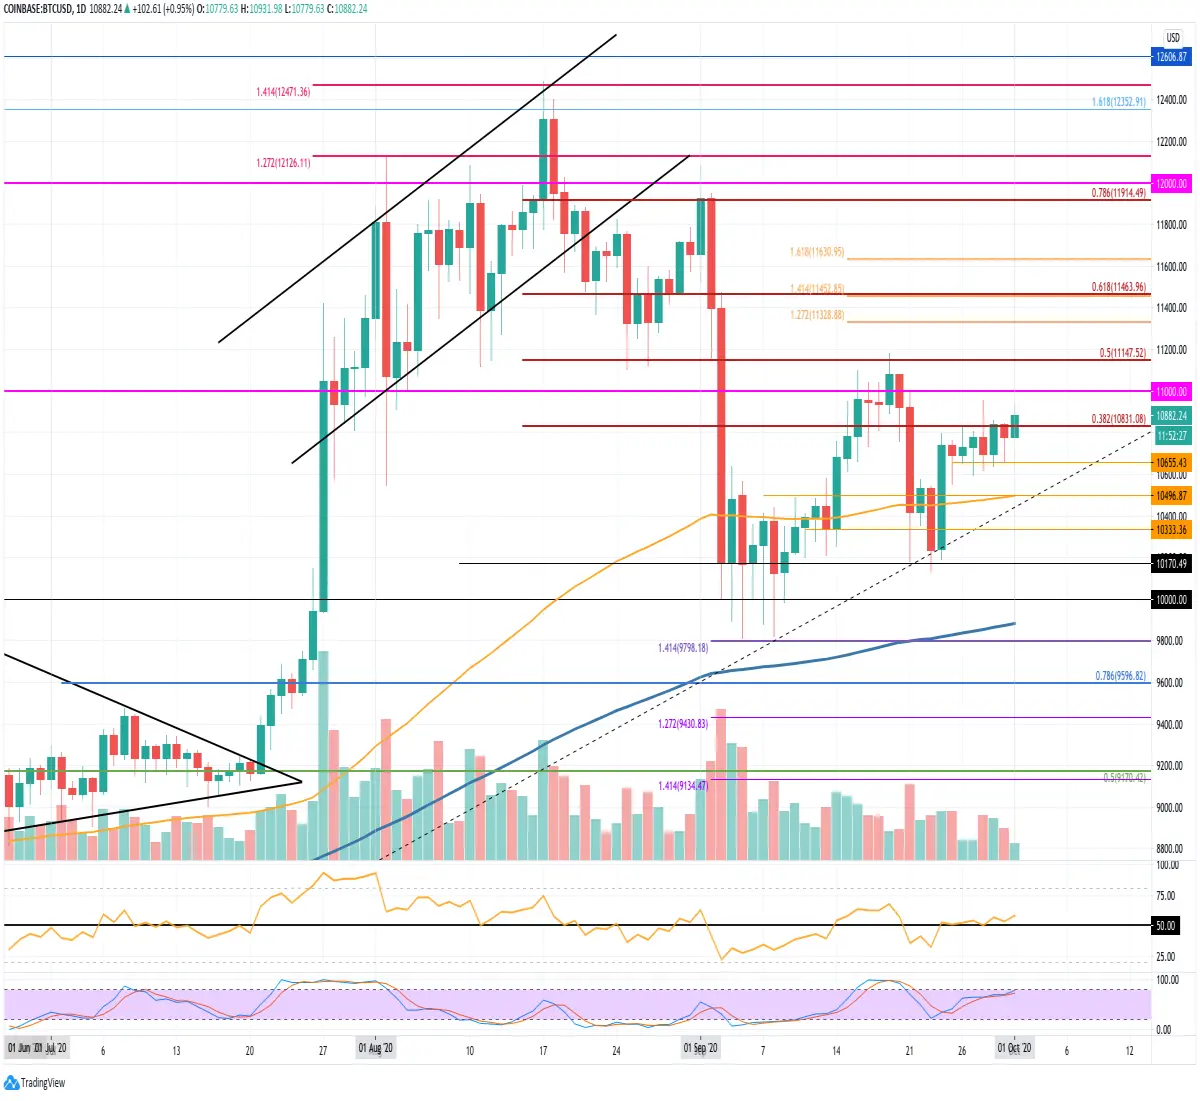
Taking a look at the daily chart above, we can clearly see the precipitous drop-off in price from the start of September. The cryptocurrency fell from $12,000 to reach as low as the $10,170 support. Luckily, Bitcoin managed to remain steady at this support during the month and rebounded in mid-September to push as high as $11,150.
From there, it ran into resistance at a bearish .5 Fib Retracement, which caused the market to roll over and head back into the $10,170 support. This time around, the support there was bolstered by the 6-month-old rising trend line, which allowed BTC to rebound higher last week.
After rebounding, BTC headed higher to reach the bearish .382 Fib Retracement resistance at $20,830. It is attempting to break this resistance, but we must wait for a daily candle close above the level to confirm the breakout.
Are We Bullish Or Bearish?
Right now, we are still neutral. The coin would need to pass above $11,150 to turn bullish in the short term but would need to break above the $12,000 level to confirm a more sustainable bullish trend.
On the other side, BTC would need to drop beneath the 6-month-old rising trend line and penetrate beneath $10,000 before we can start to consider a bearish market.
Where Can We Go From Here?
If the bulls continued higher, we could expect BTC to break above $11,000 in the first week of October.
Beyond $11,000, resistance lies at $11,150 (bearish .5 Fib Retracement), $11,328 (1.272 Fib Extension), $11,460 (bearish .618 Fib Retracement), and $11,630 (1.618 Fib Extension). This is followed by additional resistance at, $11,800, $11,915 (bearish .786 Fib Retracement), and $12,000.
On the other side, the first level of support lies at $10,800. Beneath this, support is expected at $10,655, $10,600 (100-days EMA & rising trend line support), $10,333, and $10,170.
Ethereum Overview
Ethereum also has quite a few fundamental driving factors as of recently. However, it still seems to be largely moving at the whim of Bitcoin itself.
Regardless of this, let me quickly cover some essential pieces of information that have been occurring recently.
First and foremost, you must know that everybody is excited about the upcoming upgrade to ETH 2.0. It has been on the cards for several years now as the Ethereum network prepares itself to upgrade from a PoW consensus mechanism to a PoS mechanism. As a result, the Etheruem network is expected to reach a higher scalability level with a much-needed increase in throughput on the network.
However, all is not going according to plan during the recent testing period of ETH 2.0, but it is nothing to worry about as this is what Testnets are for.
In case you are interested - the recent Spadina testnet, designed to give the developers a chance to go through the configuration of deposits and genesis - caused some trouble in the sense that the testnet suffered from a lack of finality after launch. As a result, the Ethereum developers have decided to create another testing period, dubbed Zinken, to act as another “dress rehearsal” before ETH 2.0 starts to get rolled out.
Regardless of this recent drama, ETH 2.0 is undoubtedly bound to change the game for the entire Ethereum network and should result in a significant price increase once it is realized.
In other exciting news, it seems that Ethereum miners are making much more money in fees than BTC miners right now. Data from Glassnode shows that Etheruem miners posted their highest-earning period during August as they earned a total of around $166 million in fees. This is significantly higher than the $40 million that BTC miners had earned;

It is mostly a result of the DeFi surge as to why Etehreum mining revenues have increased. All DeFi transactions appear on-chain and, therefore, require a GAS fee to be paid to miners for the transactions to be verified.
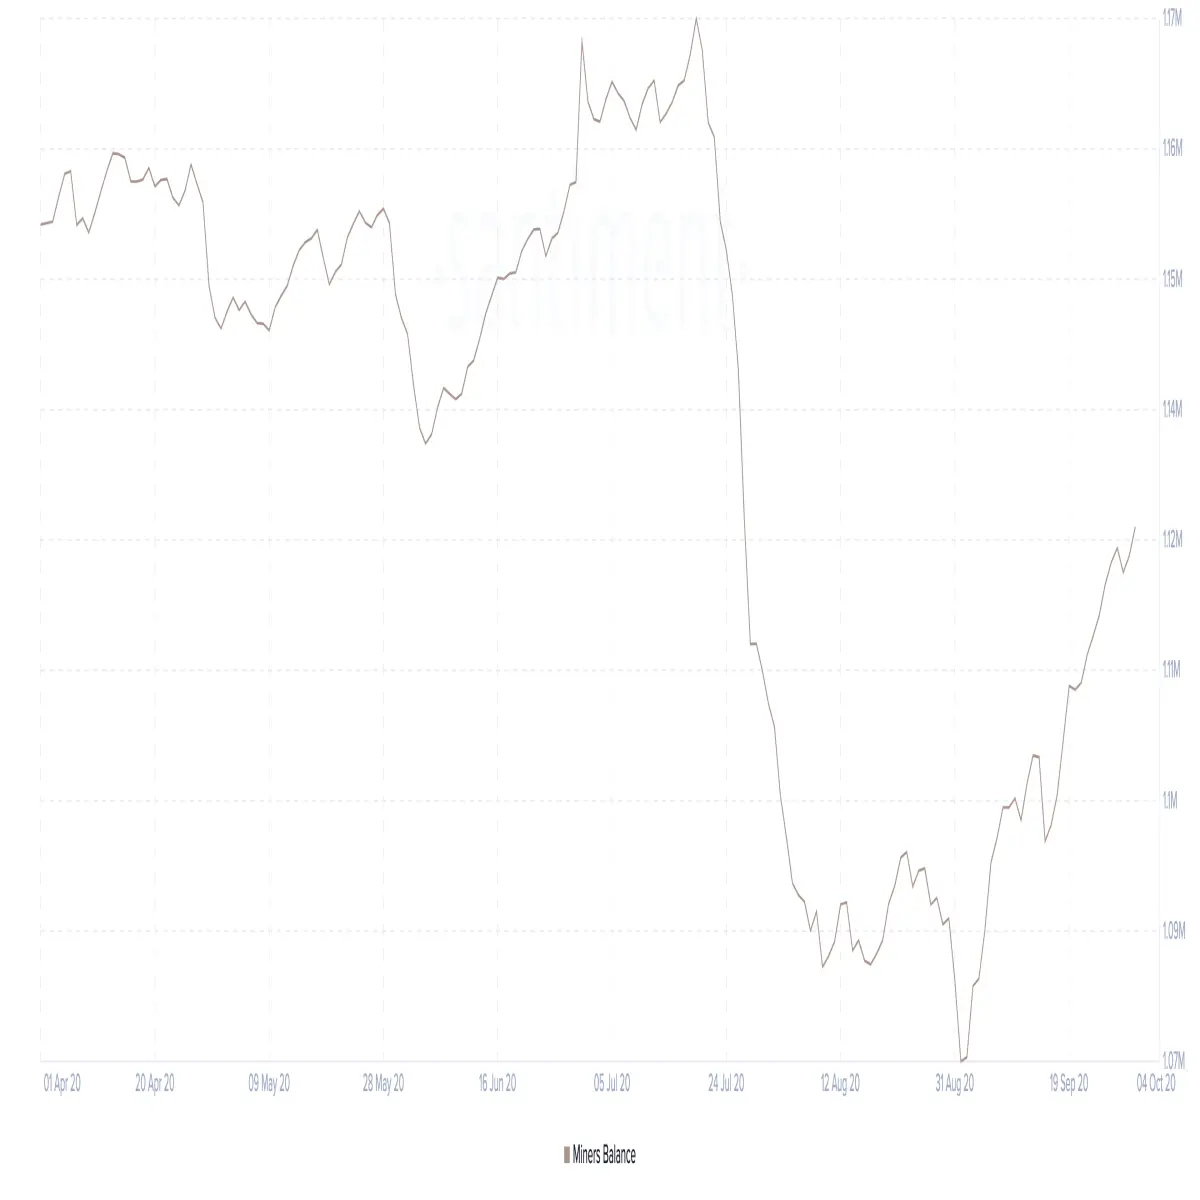
In addition to this, the Ethereum miners’ balance has also increased, showing that miners are starting to hold onto their mined ETH rather than sending them to exchanges to be sold;
Now that I have all the fundamentals out of the way for ETH, let us take a look at the technical side of the market.
Ethereum Price Analysis
ETH/USD - From July 2020 Onward - DAILY CHART
What Has Been Going On?
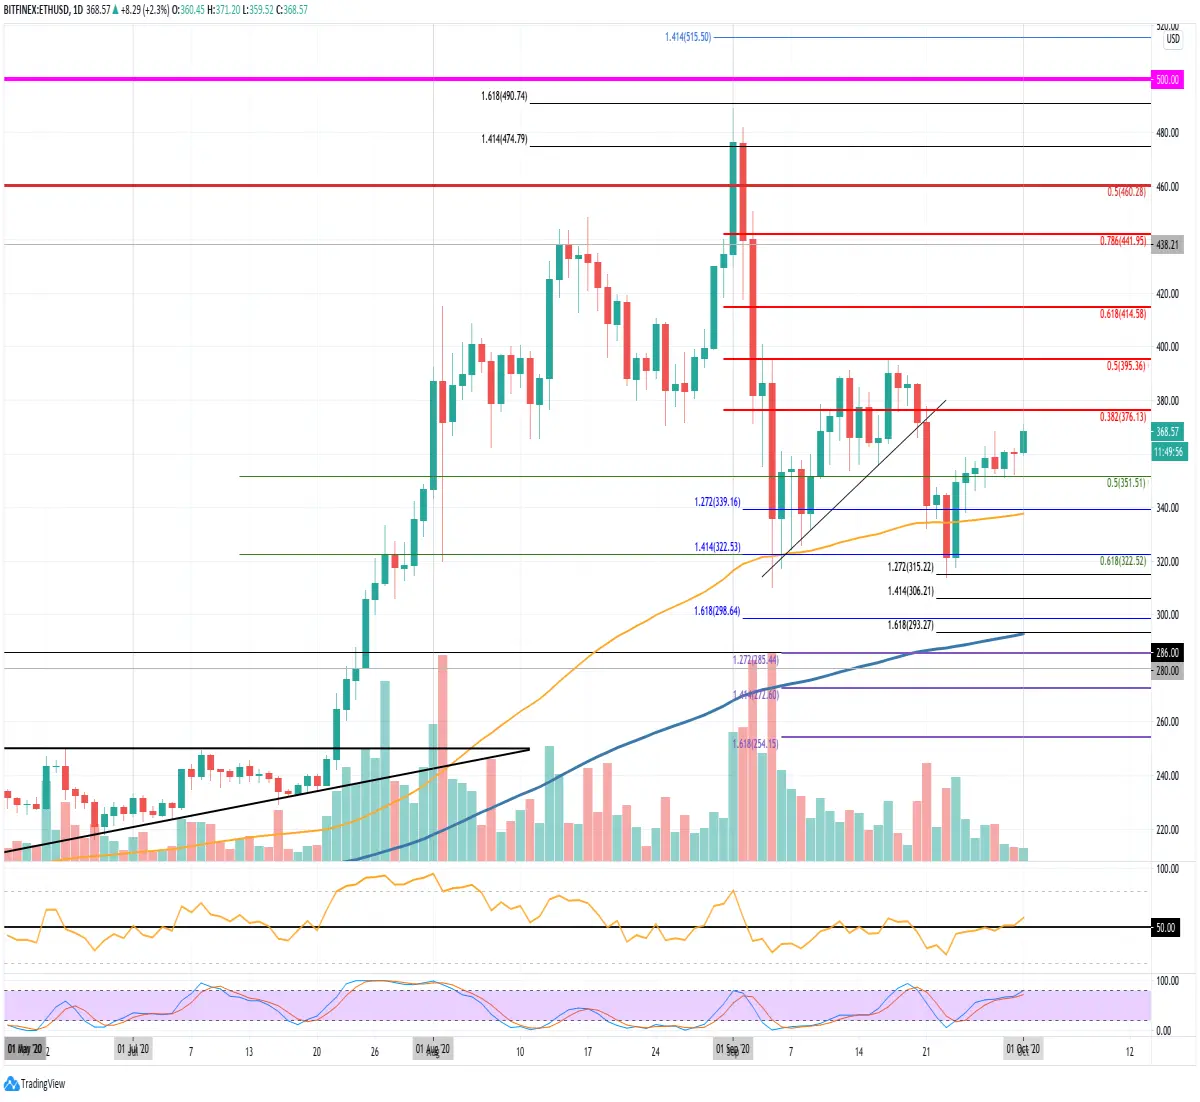
The situation looks somewhat similar for ETH/USD. The coin had dropped from $480 at the start of September as it plummeted into the support around $338. From there, it started to bounce higher during the middle of the month but failed to break the resistance at $395 - provided by a bearish .5 Fib Retracement.
As a result, Ethereum continued further lower last week until support was found at $320 - allowing Ethereum to rebound once again. Since the bounce, Etheruem managed to climb back above the $350 level as it trades at $368 today.
Are We Bullish Or Bearish?
Ethereum also has to be considered as neutral at this moment in time. The coin would need to break above $395 and $400 to start the conversation of a short-term bullish trend. On the other side, it would need to break beneath $322 to be in danger of turning bearish in the short term.
Where Can We Go From Here?
If the buyers continue to drive ETH higher, the first level of resistance is located at $376 (bearish .382 Fib Retracement). This is quickly followed by resistance at $395 (bearish .5 Fib ), and $400.
If the buyers continue to drive further higher above $400, resistance then lies at $415 (bearish .618 Fib Retracement), $441 (bearish .786 Fib Retracement), $460, and $475 (1.414 Fib Extension). Before attempting the $500 level, Ethereum would still need to clear additional resistance at $490 (1.618 Fib Extension).
On the other side, the first level of support lies at $350. Beneath this, support is located at $340 9100-days EMA), $322 (.618 Fib Retracement), $315, $306, and $300. Beneath $300, additional support lies at $293 (200-days EMA) and $280.






