
Another crazy week passes by in the cryptocurrency markets, with Bitcoin surging by another 16% to finally hit the $19,000 level. The cryptocurrency has since dropped slightly toward $18,500, but the bullish presence is alive and kicking within the market.
It all started at the beginning of October when Bitcoin was trading beneath $11,000. At that point, the cryptocurrency was struggling to break $12,000 in August, which caused it to drop back into the $10,000 support in September. At the start of October, Bitcoin broke above a consolidation pattern and started to surge. Since breaking this pattern, the cryptocurrency has exploded by around 76%.
With Bitcoin sitting just a small 7% from its $19,893 (Coinbase) all-time high (ATH) price, I would like to give you the rundown on what has caused the market to go so parabolic over these past few months.
It all started in March 2020 when the Coronavirus pandemic spread to the Western world. The United States and Europe ended up closing their borders and putting their populations into lockdowns - causing a shock to investors.
At the start of 2020, nobody would have ever dreamed that borders and businesses would be forced to close, but by March 2020, it had already occurred. As a result, the pandemic caused widespread uncertainty within the entire global economy, causing markets to crash across the board.
As a result, the United States government had to do something to keep the economy ticking over - or risk heading straight toward a new depression. They decided to fall back on fiscal stimulus, a process in which they would print money and distribute it into the economy to stimulate consumption.
This was the first domino in a series of dominos that would result in BTC approaching the ATH price this month.
The United States government took its stimulus package to the next level as it started to print trillions. In fact, to put things into perspective, they managed to print more than two centuries worth of debt in just one month;
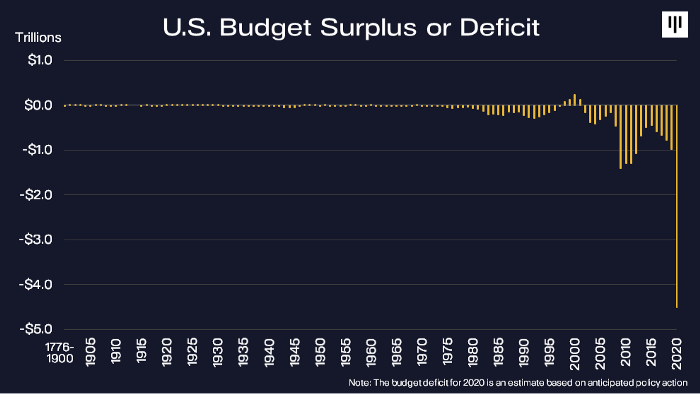
Although this was aimed to help save the economy, the knock-on effect was quite drastic. When the government prints money, it results in one thing - inflation. As a result, the purchasing power of USD in your pocket starts to erode.
The printing helped save the economy, but it was detrimental to businesses that had substantial cash reserves. These corporations were earning negative returns on their cash reserves by merely holding it - not an ideal scenario for corporations looking to maximize their returns.
So, what did they do?
Well, they started to buy up Bitcoin, of course!
It started with Grayscale, a Bitcoin hedge fund, increasing their Bitcoin holdings to over $5 billion - that’s 2.14% of the total supply. Just this past week, Grayscale continued to buy up more Bitcoin to put its total cryptocurrency holdings at $8.35 billion!
After Grayscale, a slew of other institutions started to buy up Bitcoin. These were institutions that were not even cryptocurrency-related projects. For example, MicroStrategy, a business intelligence application software developer, bought around 38,000 BTC - worth around $441 million at the time. They are still looking to increase their holdings further.
Next came the digital payments giant Square Inc, which bought up $50 million worth of Bitcoin. After that, it was announced that PayPal would start allowing its users to buy, sell, and send cryptocurrency on its platform. PayPal took things further this month after Pantera Capital revealed that the company had bought roughly 70% of all the newly mined BTC since they started accepting BTC.
You can quickly start to see how the sentiment is shifting, right?
There was a fantastic post on Publish0x that covers all of the Top 10 publicly traded companies with BTC holdings - I suggest you read it to get up-to-date with who’s been buying.
The fact that financial institutions are buying up Bitcoin at unprecedented rates has been driving BTC to near-ATH levels. This is the most significant difference between the 2017 bull run and the 2020 bull run.
In 2017, the rally toward the ATH price was primarily driven by retail investors. These are investors like you and me just FOMO’ing into BTC to get a piece of the profits. We know this when we look at the Google Trends for “Bitcoin”;
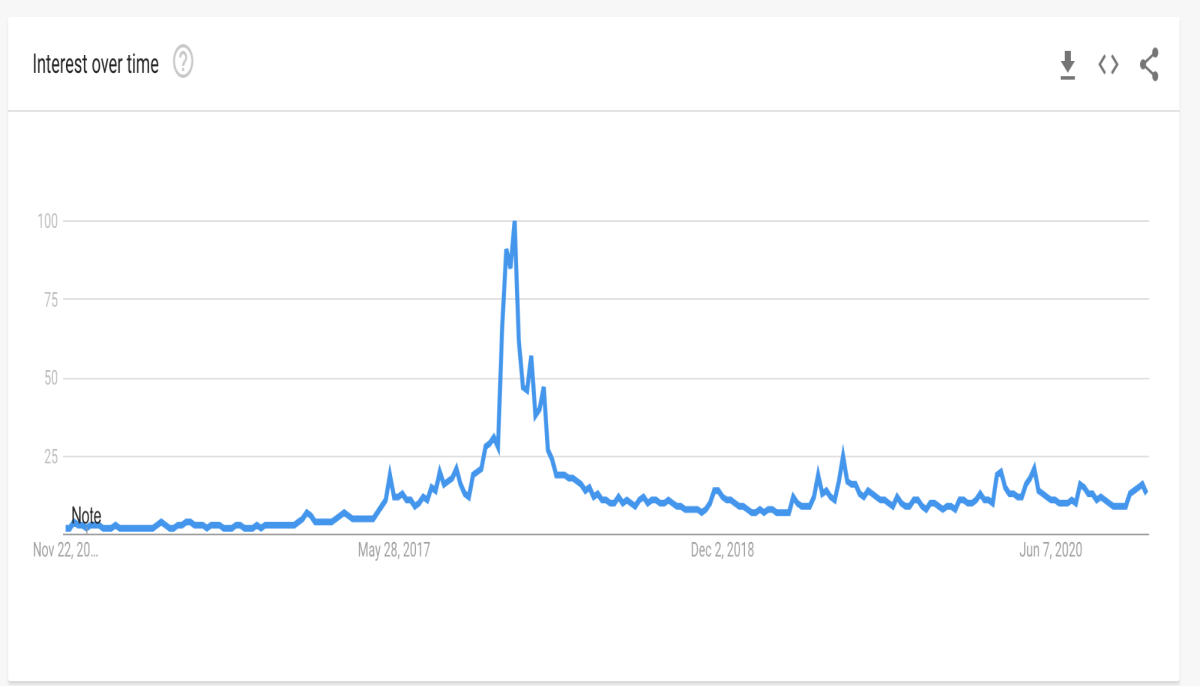
The chart shows that BTC interest spiked to its peak during the late-2017 bullish run higher. It has barely seen an uptick in the latest bull run - suggesting that retail traders are mainly keeping out of the market.
We can see this more clearly in the following chart, which shows Google Trends and Bitcoin Price on the same chart;
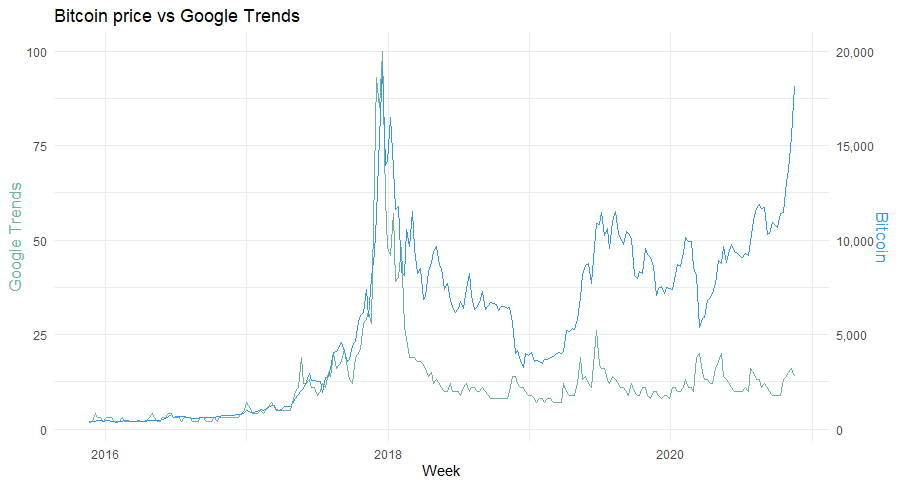
The Google Trend corresponded greatly with the Bitcoin price in the late-2017 bullish rally, but there is a strong divergence between the two in this year’s rally toward the ATH price.
Again, this is VERY BULLISH for Bitcoin.
Why?
Mainly because this is known as ‘smart money’ entering the ecosystem, investors have DEEP pockets and a very long-term vision. It is likely that these investors have sent their Bitcoin straight to cold storage and will not be intending to sell their assets anytime soon.
PlanB put this best on Twitter;
What About Ethereum?
Although Ethereum is benefiting from the BTC bull run itself - there is one other standalone driving force that is going to allow ETH to explode to fresh ATH’s eventually - Ethereum 2.0!
After years of development and months of testing, it seems that Etheruem 2.0 is already on the way. The upgrade will see the blockchain shifting from Proof-of-Work (PoW) to Proof-of-Stake (PoS), increasing the blockchain’s efficiency and scalability.
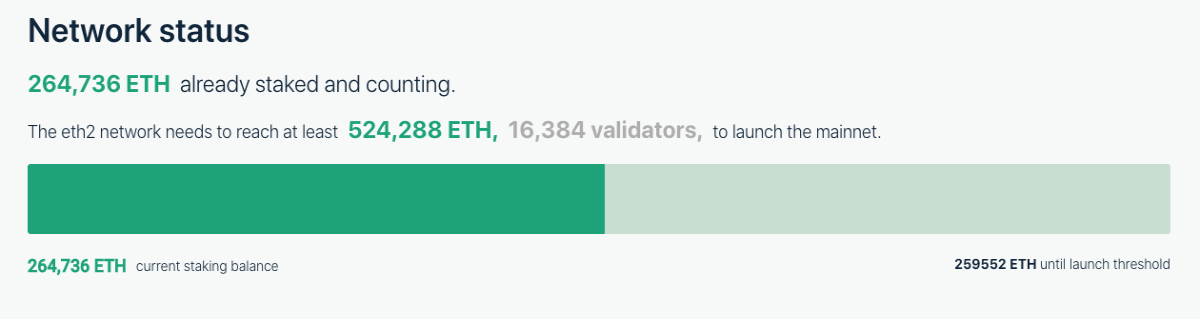
To get ETH 2.0 network going, around 524K ETH needs to be deposited into the Ethereum 2.0 launchpad by December 1st. Currently, there are around 264K that has been staked;
Let us take a quick look into both of these coins and highlight what has been going on in the market recently.
Bitcoin Price Analysis
BTC/USD - 4HR CHART -
What Has Been Going On?
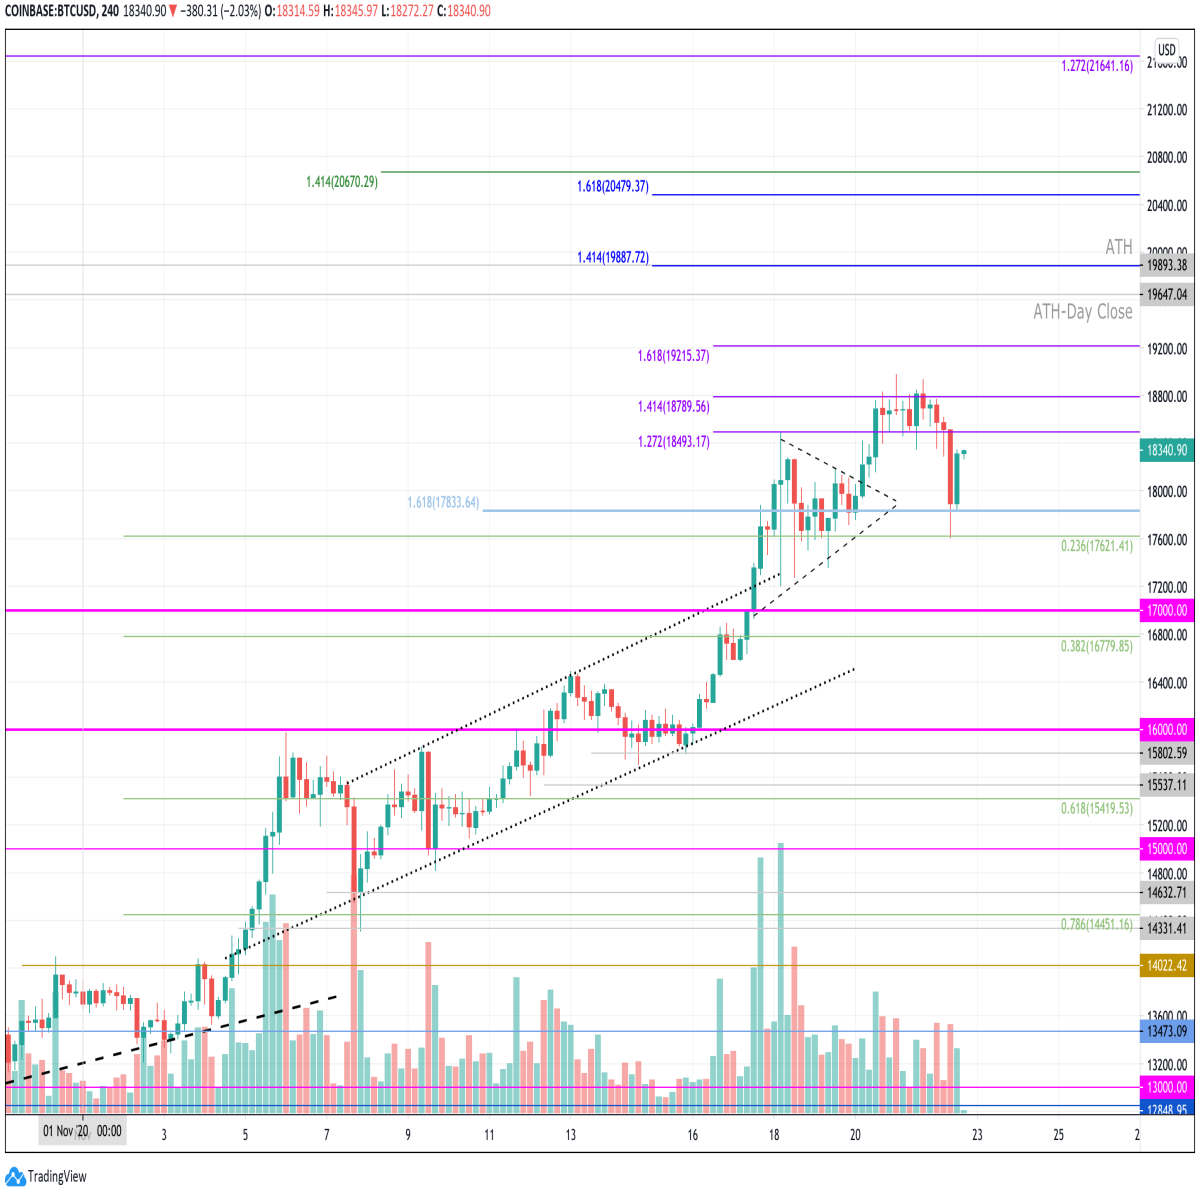
The 4HR chart above shows Bitcoin throughout November. It shows Bitcoin struggled to break above $16,000 for the first half of the month. This was eventually penetrated properly around the 16th of November as it started to surge higher last week.
The cryptocurrency continued to rally until it met the resistance at $18,495 (1.272 Fibonacci Extension level) - then it cooled off for a few days to find support at $17,600. After the short break, BTC continued to break $18,495 and hit the resistance at $18,790 (1.414 Fib Extension). It was here when BTC managed to spike above the $19,000 level briefly. However, it seems that the buyers were never actually able to cause a 4HR candle to close above the resistance at $18,790.
Today, BTC tumbled slightly, but we can see that support was easily found at $17,621 (.236 Fib Retracement). The market rebounded quickly from here and has started to push higher again.
Are We Bullish Or Bearish?
We are most certainly bullish. The cryptocurrency would need to fall at least beneath $16,000 to be in danger of turning neutral again. It would need to collapse further beneath $13,000 before being in danger of becoming bearish.
If Bitcoin does start to drop, support is first found at $17,833. Beneath this, support lies at $17,621 (.236 Fib), $17,200, and $17,000. Added support lies at $16,780 (.382 Fib), $16,400, and $16,000.
When $20K?
If the buyers push higher again, the first level of resistance is expected at $18,790 (1.414 Fib Extension). If they continue to climb above $19,000, resistance is then found at $19,215 (1.618 Fib Extension) and $19,647 - the ATH Daily closing price (the price level at which Bitcoin closed the daily candle when it reached the ATH).
Above $19,647, resistance is expected at the ATH price at $19,893 (Coinbase price). The buyers will need to contest this resistance to reach the $20K threshold.
If the buyers continue beyond $20,000, resistance is then located at $20,200, $20,480 (1.618 Fib Extension - blue), $20,670, $20,800, and $21,000.
Following this, resistance is found at $21,200, $21,500, and $21,640.
Ethereum Price Analysis
ETH/USD - DAILY CHART -
What Has Been Going On?
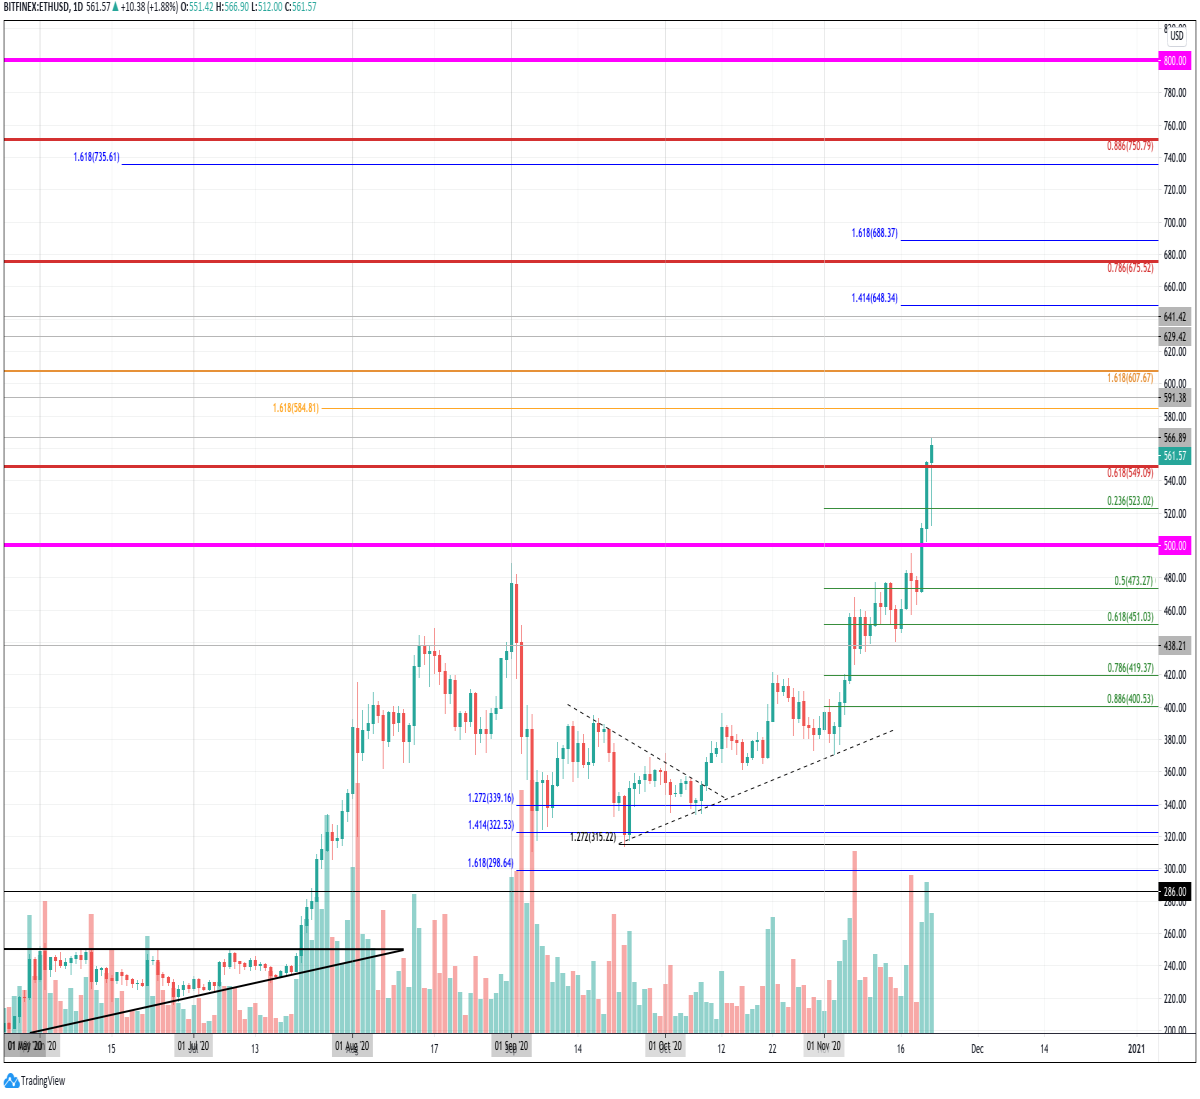
The daily chart above for Ethereum shows that ETH is in a slightly different boat from Bitcoin. Although the cryptocurrency might have seen a 45% price explosion this past month (similar to BTC’s 49% price rise in the same period), the cryptocurrency remains 54% from its ATH price of $1,570.
Ethereum also managed to break a consolidation pattern at the start of October as it pushed higher into the $420 region. The bullish run continued higher in November as the bulls pushed to $480.
The $500 resistance was just penetrated on Friday (Nov 20th), which saw the coin heading into the $550 resistance (bearish .786 Fib Retracement) yesterday (Saturday, Nov 21st).
Today, November 22nd, Ethereum continued higher to reach as high as $567.
Are We Bullish Or Bearish?
Ethereum is also to be considered as bullish right now. The coin would need to drop beneath $480 to be in danger of turning neutral, and it would have to continue further beneath the $320 before being in danger of turning bearish.
If the sellers push lower, the first level of support lies at $550. Beneath this, support is found at $423 (.236 Fib), $500, $573 (.5 Fib), and $450 (.618 Fib).
When $800?
$800 is still quite some distance away. In fact, it would need to pump by 41% to reach the level - something that is not impossible for an asset like Ethereum.
If the buyers push higher and break $566, the first level of resistance lies at $585. This is quickly followed by resistance at $591 and $600.
Beyond $600, resistance is located at $608, $630, $648 (1.414 Fib extension) and $675 (bearish .786 Fib Retracement). Additional resistance then lies at $688 (1.618 Fib Extension) and $700.
If the buyers continue to drive above $700, resistance then lies at $735 (longer termed 1.618 Fib Extension) and $750 (bearish .5 Fib Retracement). If they can clear these levels, they will be free to take a pop at $800.


