
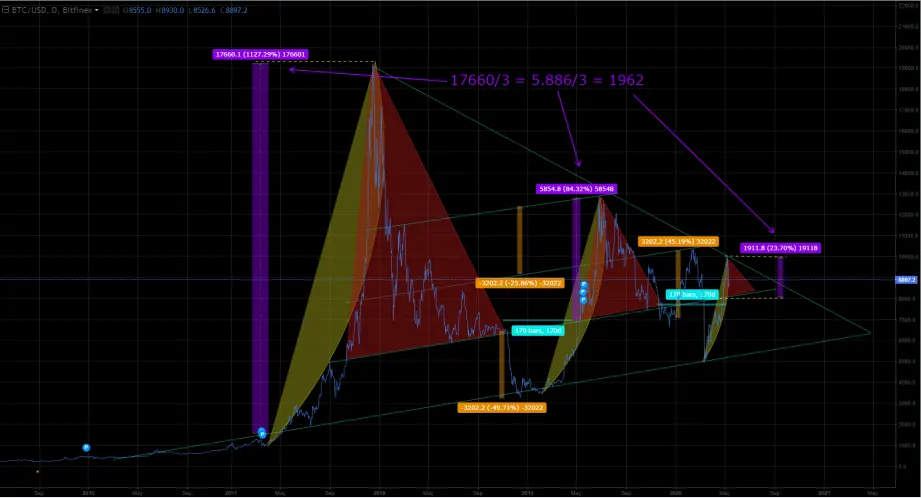
Hello!! Here I show you this graph that I have been doing for a few days. I love to draw lines and make figures and I see these relationships.
You can see 3 main arches of olive green color. followed by 2 bearish triangles and a third possible triangle.
I encourage you to look for more coincidences in the graph and tell me, I have hidden the moving averages.
Yesterday I uploaded a chart with an HCH in 4h that was not met. A shame.
I encourage you to comment on what you think of the idea, are we facing a fractal? what will be the next drawing?
Right now the price supported the 200 moving average.
I think the graph can be developed much more, but I want to see little by little how the price behaves.
I personally want it to go up to 11k now.
This chart is not to buy or sell, it is not to project the price in the short term, I hope that over 80% will break and rise to those levels.
I hope you liked it
a greeting
---Klo---






